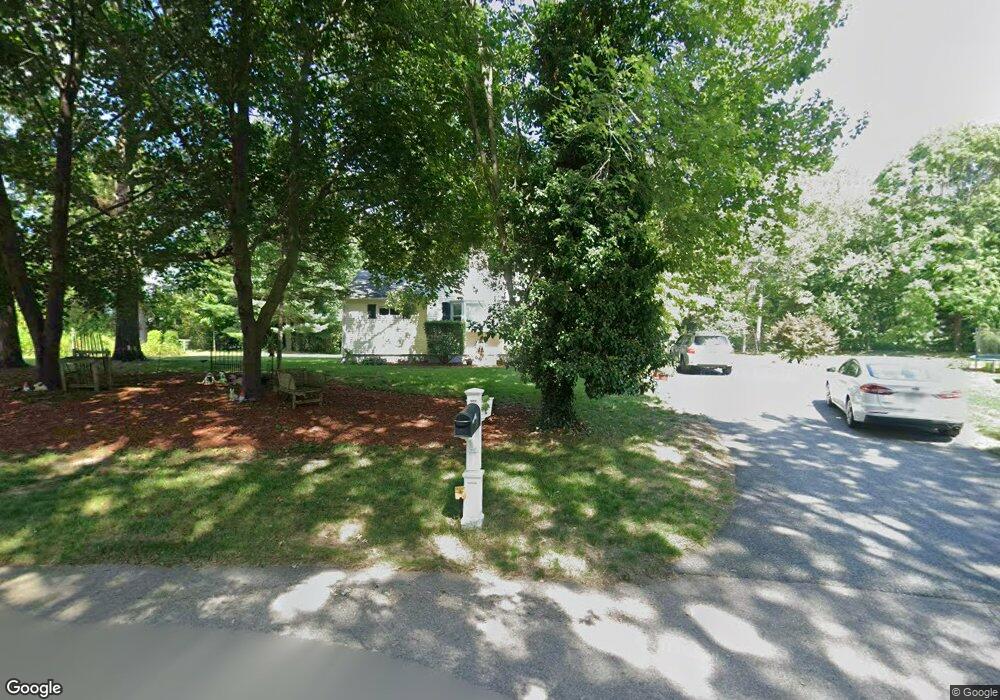
28 Glendale Rd Attleboro, MA 02703
Estimated Value: $456,000 - $495,395
3
Beds
1
Bath
1,326
Sq Ft
$359/Sq Ft
Est. Value
About This Home
This home is located at 28 Glendale Rd, Attleboro, MA 02703 and is currently estimated at $475,849, approximately $358 per square foot. 28 Glendale Rd is a home located in Bristol County with nearby schools including A. Irvin Studley Elementary School, Cyril K. Brennan Middle School, and Attleboro High School.
Ownership History
Date
Name
Owned For
Owner Type
Purchase Details
Closed on
Apr 27, 2007
Sold by
Cox David T and Cox Marilyn R
Bought by
Anderson Brian and Zhao Huiyan
Current Estimated Value
Home Financials for this Owner
Home Financials are based on the most recent Mortgage that was taken out on this home.
Original Mortgage
$206,250
Outstanding Balance
$125,524
Interest Rate
6.18%
Mortgage Type
Purchase Money Mortgage
Estimated Equity
$350,325
Create a Home Valuation Report for This Property
The Home Valuation Report is an in-depth analysis detailing your home's value as well as a comparison with similar homes in the area
Home Values in the Area
Average Home Value in this Area
Purchase History
| Date | Buyer | Sale Price | Title Company |
|---|---|---|---|
| Anderson Brian | $275,000 | -- |
Source: Public Records
Mortgage History
| Date | Status | Borrower | Loan Amount |
|---|---|---|---|
| Open | Anderson Brian | $206,250 |
Source: Public Records
Tax History Compared to Growth
Tax History
| Year | Tax Paid | Tax Assessment Tax Assessment Total Assessment is a certain percentage of the fair market value that is determined by local assessors to be the total taxable value of land and additions on the property. | Land | Improvement |
|---|---|---|---|---|
| 2025 | $5,172 | $412,100 | $176,300 | $235,800 |
| 2024 | $4,808 | $377,700 | $158,900 | $218,800 |
| 2023 | $4,787 | $349,700 | $160,500 | $189,200 |
| 2022 | $4,628 | $320,300 | $153,100 | $167,200 |
| 2021 | $2,532 | $291,600 | $147,300 | $144,300 |
| 2020 | $4,151 | $285,100 | $140,700 | $144,400 |
| 2019 | $2,693 | $278,000 | $138,100 | $139,900 |
| 2018 | $3,874 | $261,400 | $134,100 | $127,300 |
| 2017 | $3,576 | $245,800 | $130,700 | $115,100 |
| 2016 | $3,333 | $224,900 | $122,200 | $102,700 |
| 2015 | $3,330 | $226,400 | $122,200 | $104,200 |
| 2014 | $3,126 | $210,500 | $116,900 | $93,600 |
Source: Public Records
Map
Nearby Homes