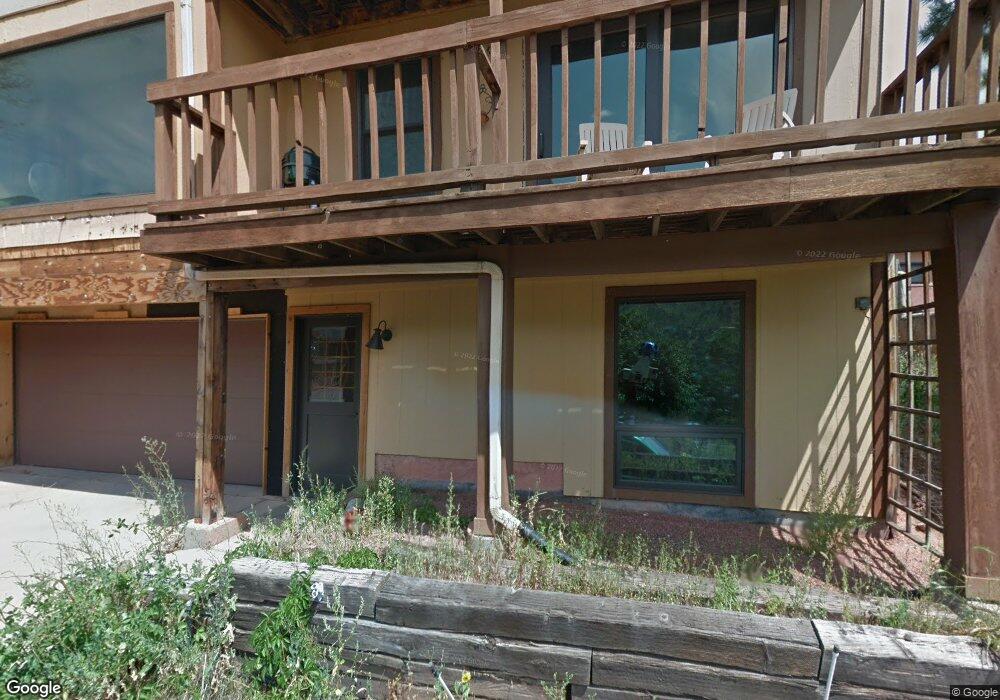
28 Grant Ave Manitou Springs, CO 80829
Estimated Value: $677,000 - $868,000
3
Beds
3
Baths
2,653
Sq Ft
$287/Sq Ft
Est. Value
About This Home
This home is located at 28 Grant Ave, Manitou Springs, CO 80829 and is currently estimated at $760,266, approximately $286 per square foot. 28 Grant Ave is a home located in El Paso County with nearby schools including Manitou Springs Elementary School, Manitou Springs Middle School, and Manitou Springs High School.
Ownership History
Date
Name
Owned For
Owner Type
Purchase Details
Closed on
Jun 28, 2019
Sold by
Freer Kipton G
Bought by
Dickson William J and Dickson Peggy L
Current Estimated Value
Home Financials for this Owner
Home Financials are based on the most recent Mortgage that was taken out on this home.
Original Mortgage
$594,878
Outstanding Balance
$523,079
Interest Rate
4%
Mortgage Type
VA
Estimated Equity
$237,187
Purchase Details
Closed on
Jan 13, 2006
Sold by
Reed Rodney A and Reed Bonnie J
Bought by
Freer Kipton G
Home Financials for this Owner
Home Financials are based on the most recent Mortgage that was taken out on this home.
Original Mortgage
$316,800
Interest Rate
6.25%
Mortgage Type
Fannie Mae Freddie Mac
Purchase Details
Closed on
Aug 1, 1979
Bought by
Freer Kipton G
Create a Home Valuation Report for This Property
The Home Valuation Report is an in-depth analysis detailing your home's value as well as a comparison with similar homes in the area
Home Values in the Area
Average Home Value in this Area
Purchase History
| Date | Buyer | Sale Price | Title Company |
|---|---|---|---|
| Dickson William J | $620,000 | Land Title Guarantee Company | |
| Freer Kipton G | $396,000 | Title America | |
| Freer Kipton G | -- | -- |
Source: Public Records
Mortgage History
| Date | Status | Borrower | Loan Amount |
|---|---|---|---|
| Open | Dickson William J | $594,878 | |
| Previous Owner | Freer Kipton G | $316,800 |
Source: Public Records
Tax History Compared to Growth
Tax History
| Year | Tax Paid | Tax Assessment Tax Assessment Total Assessment is a certain percentage of the fair market value that is determined by local assessors to be the total taxable value of land and additions on the property. | Land | Improvement |
|---|---|---|---|---|
| 2025 | $3,031 | $45,890 | -- | -- |
| 2024 | $2,815 | $44,790 | $3,980 | $40,810 |
| 2022 | $3,155 | $42,670 | $3,750 | $38,920 |
| 2021 | $3,289 | $43,900 | $3,860 | $40,040 |
| 2020 | $2,879 | $36,610 | $3,220 | $33,390 |
| 2019 | $3,057 | $36,610 | $3,220 | $33,390 |
| 2018 | $2,833 | $32,200 | $2,500 | $29,700 |
| 2017 | $2,505 | $32,200 | $2,500 | $29,700 |
| 2016 | $2,485 | $31,930 | $2,510 | $29,420 |
| 2015 | $2,456 | $31,930 | $2,510 | $29,420 |
| 2014 | $2,139 | $29,570 | $2,220 | $27,350 |
Source: Public Records
Map
Nearby Homes
- 527 Canon Ave
- 529 Canon Ave
- 128 Cave Ave
- 105 Pawnee Ave
- 136 Cave Ave
- 103 Deer Path Ave
- 140 Cave Ave
- 0 Manitou Terrace
- 34 Fountain Place
- 1107 Manitou Ave
- 1117 Manitou Ave
- 478 El Paso Blvd
- 125 Ruxton Ave
- 135 South Path
- 153 Capitol Hill Ave
- 0 Charcas Rd Unit REC3377987
- 0 Charcas Rd Unit 1024513
- 151 Ruxton Ave
- LOTS 1-10 Peakview Blvd
- 206 Pine Ridge Ave