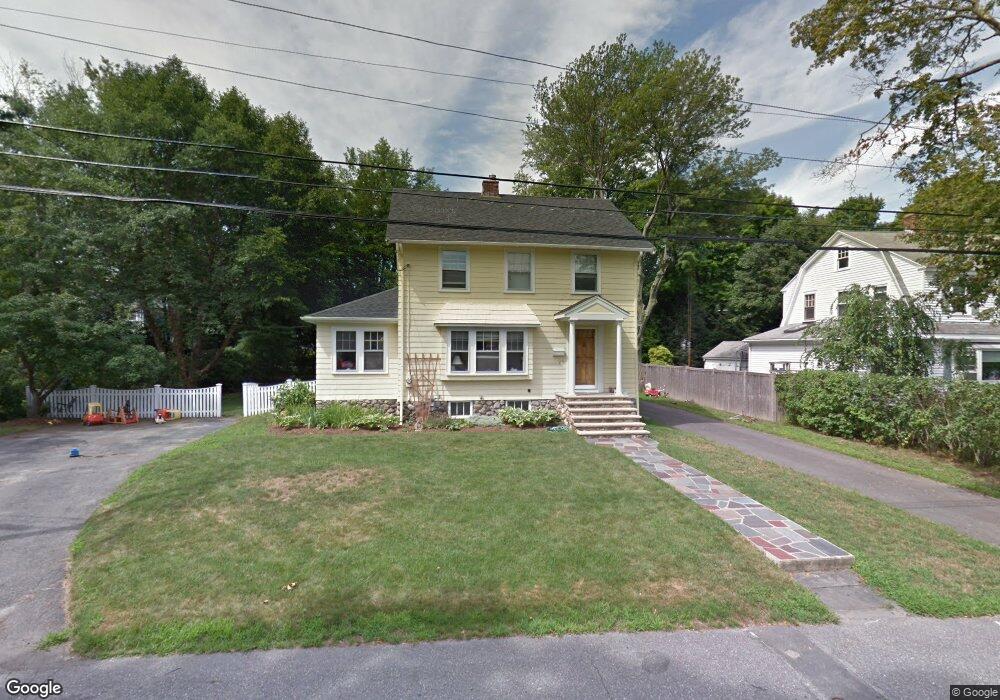
28 Harding Rd Lexington, MA 02420
North Lexington NeighborhoodEstimated Value: $1,488,000 - $1,839,000
About This Home
This home is located at 28 Harding Rd, Lexington, MA 02420 and is currently estimated at $1,618,780, approximately $667 per square foot. 28 Harding Rd is a home located in Middlesex County with nearby schools including Joseph Estabrook Elementary School, William Diamond Middle School, and Lexington High School.
Ownership History
We collect this data history from publicly available records. To have your information removed, we recommend requesting removal directly through your county’s website.
Purchase Details
Purchase Details
Home Values in the Area
Average Home Value in this Area
Purchase History
We collect this data history from publicly available records. To have your information removed, we recommend requesting removal directly through your county’s website.
| Date | Buyer | Sale Price | Title Company |
|---|---|---|---|
| $662,500 | -- | ||
| $436,000 | -- |
Mortgage History
We collect this data history from publicly available records. To have your information removed, we recommend requesting removal directly through your county’s website.
| Date | Status | Borrower | Loan Amount |
|---|---|---|---|
| Open | $320,000 | ||
| Closed | $335,800 | ||
| Closed | $344,000 | ||
| Closed | $397,500 | ||
| Closed | $400,000 | ||
| Previous Owner | $286,500 |
Tax History
We collect this data history from publicly available records. To have your information removed, we recommend requesting removal directly through your county’s website.
| Year | Tax Paid | Tax Assessment Tax Assessment Total Assessment is a certain percentage of the fair market value that is determined by local assessors to be the total taxable value of land and additions on the property. | Land | Improvement |
|---|---|---|---|---|
| 2025 | $18,321 | $1,498,000 | $792,000 | $706,000 |
| 2024 | $17,873 | $1,459,000 | $754,000 | $705,000 |
| 2023 | $17,524 | $1,348,000 | $686,000 | $662,000 |
| 2022 | $16,491 | $1,195,000 | $623,000 | $572,000 |
| 2021 | $15,527 | $1,079,000 | $568,000 | $511,000 |
| 2020 | $15,019 | $1,069,000 | $568,000 | $501,000 |
| 2019 | $14,402 | $1,020,000 | $541,000 | $479,000 |
| 2018 | $14,086 | $985,000 | $515,000 | $470,000 |
| 2017 | $12,664 | $874,000 | $504,000 | $370,000 |
| 2016 | $12,176 | $834,000 | $459,000 | $375,000 |
| 2015 | $11,829 | $796,000 | $417,000 | $379,000 |
| 2014 | $11,152 | $719,000 | $379,000 | $340,000 |
Map
- 7 Park St
- 99 Blake Rd
- 31 Wyman Rd
- 22 Wyman Rd
- 4 Augustus Rd
- 155 Reed St
- 10 Victory Garden Way
- 18 Victory Garden Way
- 15 Calvin St
- 7 Diamond Rd
- 30 Calvin St
- 6 Manning St
- 423 Bedford St
- 109 Grove St
- 11 Longfellow Rd
- 93 Bedford St Unit 101
- 93 Bedford St Unit 103
- 93 Bedford St Unit 104
- 79 Bedford St Unit 79
- 148 Cedar St
Ask me questions while you tour the home.