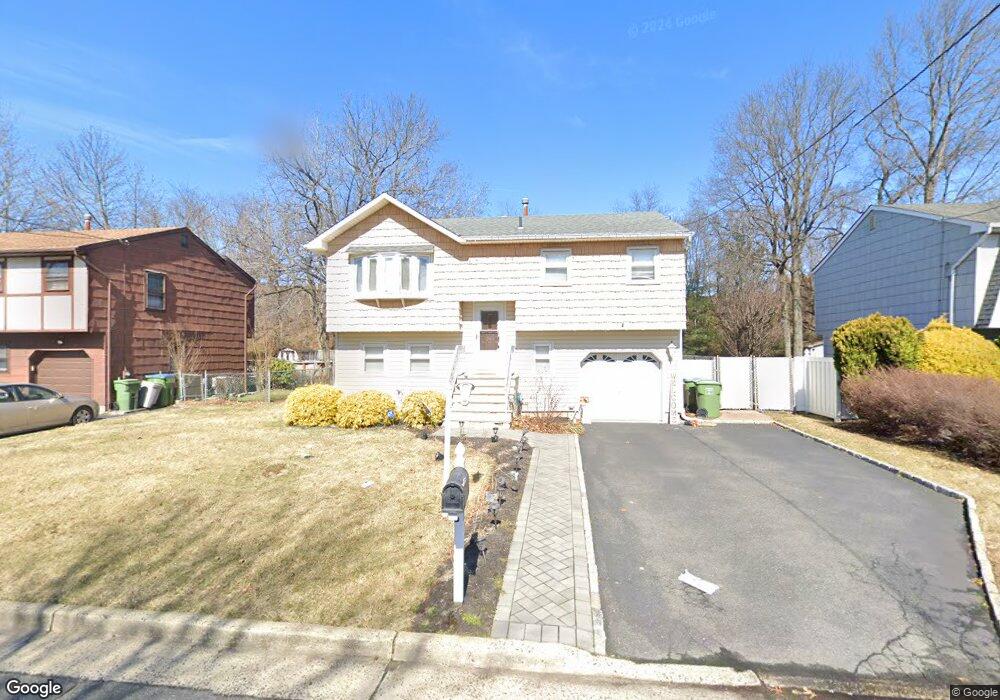
28 Heman St Edison, NJ 08837
Estimated Value: $671,186 - $729,000
3
Beds
2
Baths
1,568
Sq Ft
$447/Sq Ft
Est. Value
About This Home
This home is located at 28 Heman St, Edison, NJ 08837 and is currently estimated at $700,297, approximately $446 per square foot. 28 Heman St is a home located in Middlesex County with nearby schools including Benjamin Franklin Elementary School, Herbert Hoover Middle School, and Edison High School.
Ownership History
Date
Name
Owned For
Owner Type
Purchase Details
Closed on
Oct 10, 2019
Sold by
Papa Vincent and Papa Lisa
Bought by
Garcia Cherri Lee
Current Estimated Value
Home Financials for this Owner
Home Financials are based on the most recent Mortgage that was taken out on this home.
Original Mortgage
$349,618
Outstanding Balance
$305,653
Interest Rate
3.4%
Mortgage Type
New Conventional
Estimated Equity
$394,644
Purchase Details
Closed on
Dec 23, 1988
Bought by
Papa Vincent and Papa Lisa
Create a Home Valuation Report for This Property
The Home Valuation Report is an in-depth analysis detailing your home's value as well as a comparison with similar homes in the area
Home Values in the Area
Average Home Value in this Area
Purchase History
| Date | Buyer | Sale Price | Title Company |
|---|---|---|---|
| Garcia Cherri Lee | $385,000 | New Horizon Abstract Inc | |
| Papa Vincent | $180,000 | -- |
Source: Public Records
Mortgage History
| Date | Status | Borrower | Loan Amount |
|---|---|---|---|
| Open | Garcia Cherri Lee | $349,618 |
Source: Public Records
Tax History Compared to Growth
Tax History
| Year | Tax Paid | Tax Assessment Tax Assessment Total Assessment is a certain percentage of the fair market value that is determined by local assessors to be the total taxable value of land and additions on the property. | Land | Improvement |
|---|---|---|---|---|
| 2025 | $9,876 | $165,900 | $78,500 | $87,400 |
| 2024 | $9,823 | $165,900 | $78,500 | $87,400 |
| 2023 | $9,823 | $165,900 | $78,500 | $87,400 |
| 2022 | $9,826 | $165,900 | $78,500 | $87,400 |
| 2021 | $9,793 | $165,900 | $78,500 | $87,400 |
| 2020 | $9,703 | $165,900 | $78,500 | $87,400 |
| 2019 | $9,337 | $165,900 | $78,500 | $87,400 |
| 2018 | $9,111 | $165,900 | $78,500 | $87,400 |
| 2017 | $8,919 | $165,900 | $78,500 | $87,400 |
| 2016 | $8,753 | $165,900 | $78,500 | $87,400 |
| 2015 | $8,418 | $165,900 | $78,500 | $87,400 |
| 2014 | $8,172 | $165,900 | $78,500 | $87,400 |
Source: Public Records
Map
Nearby Homes
- 174 Alcoa Ave
- 84 Heman St
- 27 Ginger Dr
- 153 Howard Ave
- 146 Howard Ave
- 105 Howard Ave
- 95 E Walnut St
- 97 Howard Ave
- 385 Pierson Ave
- 35 Orchard St
- 28 Plymouth Place
- 33 Ethel Place
- 81 Liddle Ave
- 1 U S Route 1
- 103 Liddle Ave
- 99 Liddle Ave Unit B10
- 71 Liddle Ave
- 162 Brower Ave
- 62 Macarthur Dr
- 52 Macarthur Dr