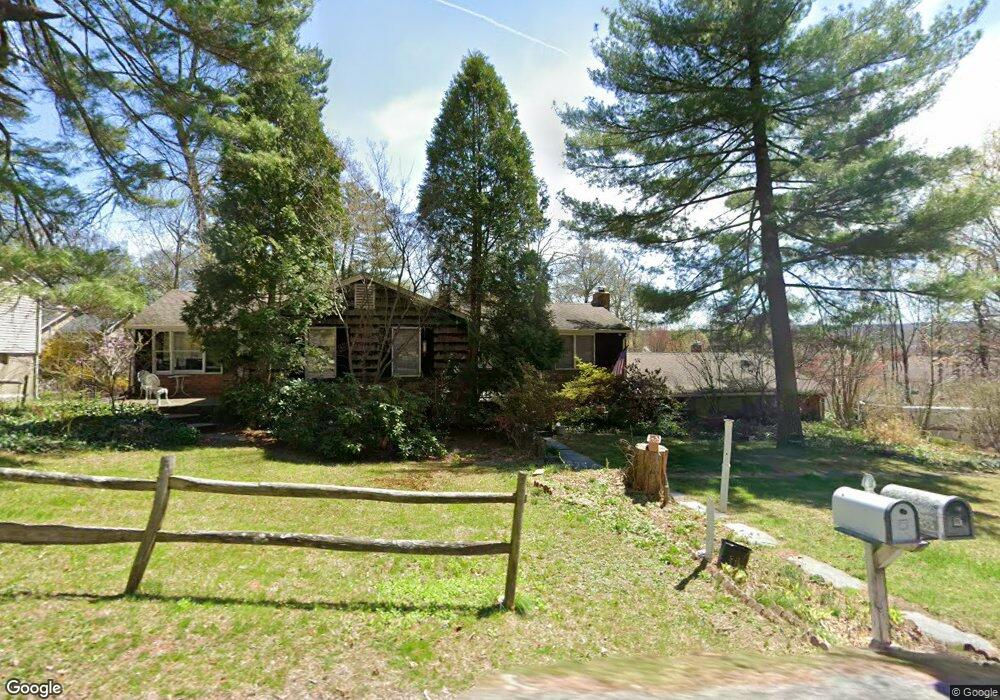
28 Hemlock Ln West Milford, NJ 07480
Estimated Value: $438,000 - $567,000
--
Bed
--
Bath
1,512
Sq Ft
$322/Sq Ft
Est. Value
About This Home
This home is located at 28 Hemlock Ln, West Milford, NJ 07480 and is currently estimated at $487,411, approximately $322 per square foot. 28 Hemlock Ln is a home located in Passaic County with nearby schools including Macopin Middle School and West Milford High School.
Ownership History
Date
Name
Owned For
Owner Type
Purchase Details
Closed on
Feb 13, 1998
Sold by
Mossler Lester M
Bought by
Poole Scott and Denny Kathleen
Current Estimated Value
Home Financials for this Owner
Home Financials are based on the most recent Mortgage that was taken out on this home.
Original Mortgage
$120,000
Outstanding Balance
$20,961
Interest Rate
6.85%
Estimated Equity
$466,450
Purchase Details
Closed on
Mar 21, 1996
Sold by
Bickel Douglas
Bought by
Mossler Lester
Home Financials for this Owner
Home Financials are based on the most recent Mortgage that was taken out on this home.
Original Mortgage
$109,000
Interest Rate
6.9%
Create a Home Valuation Report for This Property
The Home Valuation Report is an in-depth analysis detailing your home's value as well as a comparison with similar homes in the area
Home Values in the Area
Average Home Value in this Area
Purchase History
| Date | Buyer | Sale Price | Title Company |
|---|---|---|---|
| Poole Scott | $164,000 | -- | |
| Mossler Lester | $164,000 | -- |
Source: Public Records
Mortgage History
| Date | Status | Borrower | Loan Amount |
|---|---|---|---|
| Open | Poole Scott | $120,000 | |
| Previous Owner | Mossler Lester | $109,000 |
Source: Public Records
Tax History Compared to Growth
Tax History
| Year | Tax Paid | Tax Assessment Tax Assessment Total Assessment is a certain percentage of the fair market value that is determined by local assessors to be the total taxable value of land and additions on the property. | Land | Improvement |
|---|---|---|---|---|
| 2025 | $10,549 | $260,200 | $96,900 | $163,300 |
| 2024 | $10,603 | $260,200 | $96,900 | $163,300 |
| 2022 | $10,065 | $260,200 | $96,900 | $163,300 |
| 2021 | $9,849 | $260,200 | $96,900 | $163,300 |
| 2020 | $9,744 | $260,200 | $96,900 | $163,300 |
| 2019 | $9,614 | $260,200 | $96,900 | $163,300 |
| 2018 | $9,591 | $260,200 | $96,900 | $163,300 |
| 2017 | $9,635 | $260,200 | $96,900 | $163,300 |
| 2016 | $9,651 | $260,200 | $96,900 | $163,300 |
| 2015 | $9,539 | $260,200 | $96,900 | $163,300 |
| 2014 | $9,307 | $259,400 | $96,900 | $162,500 |
Source: Public Records
Map
Nearby Homes