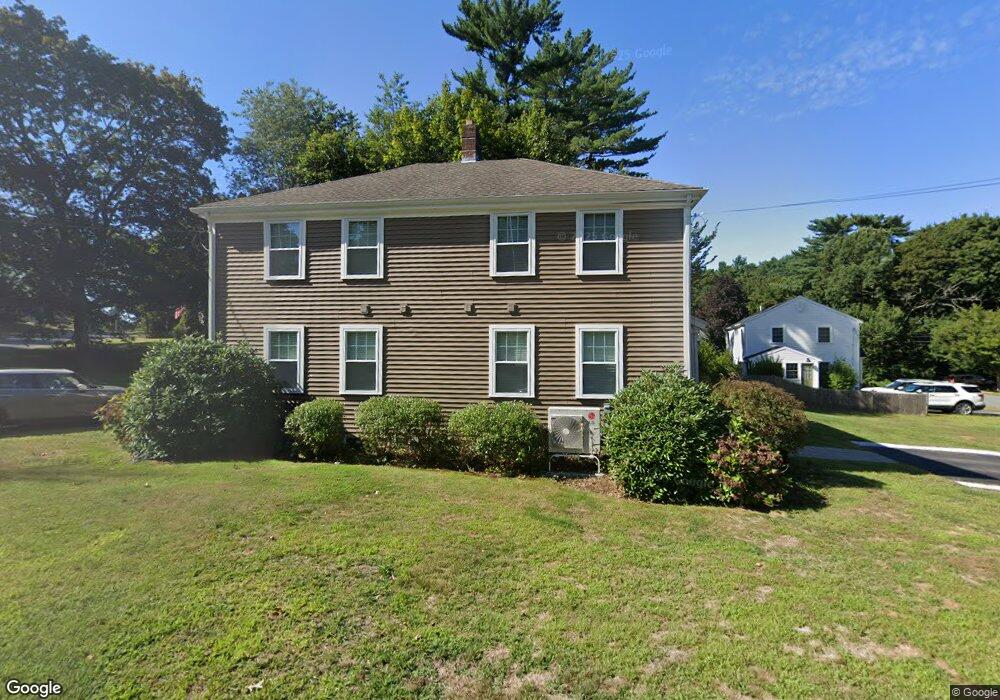
28 Hemlock Rd Unit 28 Hingham, MA 02043
Estimated Value: $882,000 - $989,000
2
Beds
1
Bath
840
Sq Ft
$1,111/Sq Ft
Est. Value
About This Home
This home is located at 28 Hemlock Rd Unit 28, Hingham, MA 02043 and is currently estimated at $933,572, approximately $1,111 per square foot. 28 Hemlock Rd Unit 28 is a home located in Plymouth County with nearby schools including Plymouth River Elementary School, Hingham Middle School, and Hingham High School.
Ownership History
Date
Name
Owned For
Owner Type
Purchase Details
Closed on
Aug 25, 2016
Sold by
Garrity Clare C
Bought by
Harborview Development
Current Estimated Value
Home Financials for this Owner
Home Financials are based on the most recent Mortgage that was taken out on this home.
Original Mortgage
$1,500,000
Outstanding Balance
$1,191,237
Interest Rate
3.42%
Mortgage Type
Unknown
Estimated Equity
-$257,665
Purchase Details
Closed on
Dec 3, 2002
Sold by
Kma & Sca Llc and Armstrong Kristin M
Bought by
Garrity Clare C
Home Financials for this Owner
Home Financials are based on the most recent Mortgage that was taken out on this home.
Original Mortgage
$280,000
Interest Rate
6.16%
Mortgage Type
Purchase Money Mortgage
Purchase Details
Closed on
Apr 30, 1996
Sold by
Johnston Charles P
Bought by
Mahoney Kristin
Home Financials for this Owner
Home Financials are based on the most recent Mortgage that was taken out on this home.
Original Mortgage
$137,900
Interest Rate
7.81%
Mortgage Type
Purchase Money Mortgage
Create a Home Valuation Report for This Property
The Home Valuation Report is an in-depth analysis detailing your home's value as well as a comparison with similar homes in the area
Purchase History
| Date | Buyer | Sale Price | Title Company |
|---|---|---|---|
| Harborview Development | $400,000 | -- | |
| Garrity Clare C | $370,500 | -- | |
| Mahoney Kristin | $145,250 | -- |
Source: Public Records
Mortgage History
| Date | Status | Borrower | Loan Amount |
|---|---|---|---|
| Open | Harborview Development | $1,500,000 | |
| Previous Owner | Mahoney Kristin | $280,000 | |
| Previous Owner | Mahoney Kristin | $65,000 | |
| Previous Owner | Mahoney Kristin | $137,900 |
Source: Public Records
Tax History
| Year | Tax Paid | Tax Assessment Tax Assessment Total Assessment is a certain percentage of the fair market value that is determined by local assessors to be the total taxable value of land and additions on the property. | Land | Improvement |
|---|---|---|---|---|
| 2025 | $8,750 | $818,500 | $320,000 | $498,500 |
| 2024 | $8,881 | $818,500 | $320,000 | $498,500 |
| 2023 | $7,083 | $708,300 | $297,200 | $411,100 |
| 2022 | $7,573 | $655,100 | $259,100 | $396,000 |
| 2021 | $7,421 | $628,900 | $259,100 | $369,800 |
| 2020 | $7,251 | $628,900 | $259,100 | $369,800 |
| 2019 | $6,677 | $565,400 | $259,100 | $306,300 |
| 2018 | $5,173 | $439,500 | $259,100 | $180,400 |
| 2017 | $4,639 | $378,700 | $255,900 | $122,800 |
| 2016 | $4,722 | $378,100 | $243,700 | $134,400 |
| 2015 | $4,220 | $336,800 | $215,500 | $121,300 |
Source: Public Records
Map
Nearby Homes
- 1 Hemlock Rd
- 6 Brewer Way
- 156 Fort Hill St
- 2 Black Rock Dr Unit 21
- 2 Black Rock Dr
- 428 Main St
- 1297 Pleasant St
- 168 Stayner Dr Unit 168
- 7 Lewis Ct
- 43 Filomena St
- 425 East St
- 6 Adams Ct
- 5 Old County Rd
- 21 Hersey St
- 30 Puritan Rd
- 5 Endicott St
- 225 South St Unit 1
- 32 Lazell St
- 14 Cross St
- 19 Lantern Ln
- 28 Hemlock Rd
- 30 Hemlock Rd
- 26 Hemlock Rd
- 32 Hemlock Rd
- 33 Hemlock Rd
- 33 Hemlock Rd Unit 1,1
- 35 Hemlock Rd
- 35 Hemlock Rd Unit 33
- 31 Hemlock Rd
- 37 Hemlock Rd
- 27 Hemlock Rd
- 29 Hemlock Rd
- 22 Hemlock Rd
- 41 Hemlock Rd
- 43 Hemlock Rd
- 43 Hemlock Rd Unit 43 Hemlock
- 25 Hemlock Rd
- 21 Hemlock Rd
- 24 Nutty Hill Rd
- 36 Hemlock Rd
Your Personal Tour Guide
Ask me questions while you tour the home.