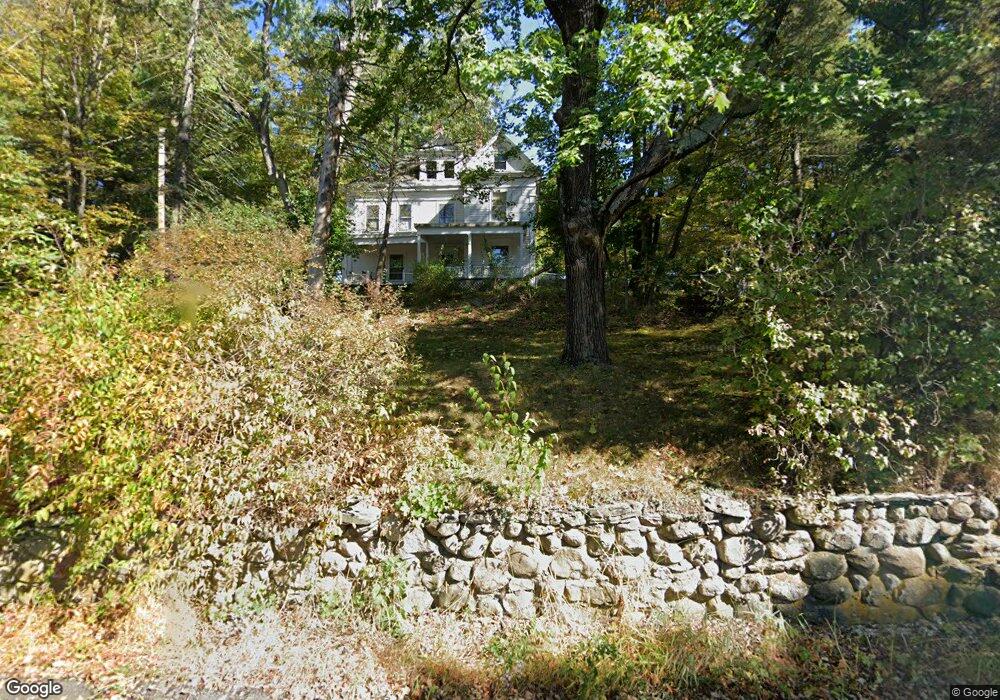
28 High St Unit 30 Pepperell, MA 01463
Estimated Value: $587,000 - $936,000
5
Beds
2
Baths
3,360
Sq Ft
$209/Sq Ft
Est. Value
About This Home
This home is located at 28 High St Unit 30, Pepperell, MA 01463 and is currently estimated at $702,302, approximately $209 per square foot. 28 High St Unit 30 is a home located in Middlesex County with nearby schools including North Middlesex Regional High School, Pepperell Christian Academy, and Maple Dene & Moppet School.
Ownership History
Date
Name
Owned For
Owner Type
Purchase Details
Closed on
Oct 16, 1997
Sold by
Capes Raymond N and Capes Jacquelyn A
Bought by
Fulton Robert D and Fulton Janice L
Current Estimated Value
Home Financials for this Owner
Home Financials are based on the most recent Mortgage that was taken out on this home.
Original Mortgage
$158,850
Outstanding Balance
$25,543
Interest Rate
7.46%
Mortgage Type
Purchase Money Mortgage
Estimated Equity
$676,759
Create a Home Valuation Report for This Property
The Home Valuation Report is an in-depth analysis detailing your home's value as well as a comparison with similar homes in the area
Home Values in the Area
Average Home Value in this Area
Purchase History
| Date | Buyer | Sale Price | Title Company |
|---|---|---|---|
| Fulton Robert D | $176,500 | -- |
Source: Public Records
Mortgage History
| Date | Status | Borrower | Loan Amount |
|---|---|---|---|
| Open | Fulton Robert D | $158,850 | |
| Previous Owner | Fulton Robert D | $80,000 |
Source: Public Records
Tax History
| Year | Tax Paid | Tax Assessment Tax Assessment Total Assessment is a certain percentage of the fair market value that is determined by local assessors to be the total taxable value of land and additions on the property. | Land | Improvement |
|---|---|---|---|---|
| 2025 | $8,003 | $547,000 | $161,500 | $385,500 |
| 2024 | $7,628 | $531,600 | $146,100 | $385,500 |
| 2023 | $7,326 | $483,900 | $146,100 | $337,800 |
| 2022 | $7,479 | $436,100 | $130,700 | $305,400 |
| 2021 | $7,448 | $415,600 | $115,400 | $300,200 |
| 2020 | $7,098 | $418,000 | $115,400 | $302,600 |
| 2019 | $6,495 | $391,500 | $115,400 | $276,100 |
| 2018 | $5,910 | $360,600 | $115,400 | $245,200 |
| 2017 | $5,495 | $345,800 | $107,700 | $238,100 |
| 2016 | $5,640 | $341,200 | $107,700 | $233,500 |
| 2015 | $5,442 | $341,200 | $107,700 | $233,500 |
| 2014 | $5,291 | $333,600 | $107,700 | $225,900 |
Source: Public Records
Map
Nearby Homes
- 38 River Rd Unit 11
- 10 Bennett St
- 28-30 Groton St
- 114 Groton St
- 29 Tarbell St
- 39 Hollis St Unit A
- 38 Tarbell St Unit 5B
- 38 Tarbell St Unit 1D
- 14 Brookline St
- 208 North St
- 179 Wyman Rd
- 39 Mount Lebanon St
- 1 Nashua Rd
- 20 A Legacy Ln Unit 20A
- 109 Townsend St
- 120 Townsend St Unit 1
- 120 Townsend St Unit 2
- 24 Unkety Brook Way
- 18 Maple St Unit 14
- 44 Nod Rd
Your Personal Tour Guide
Ask me questions while you tour the home.