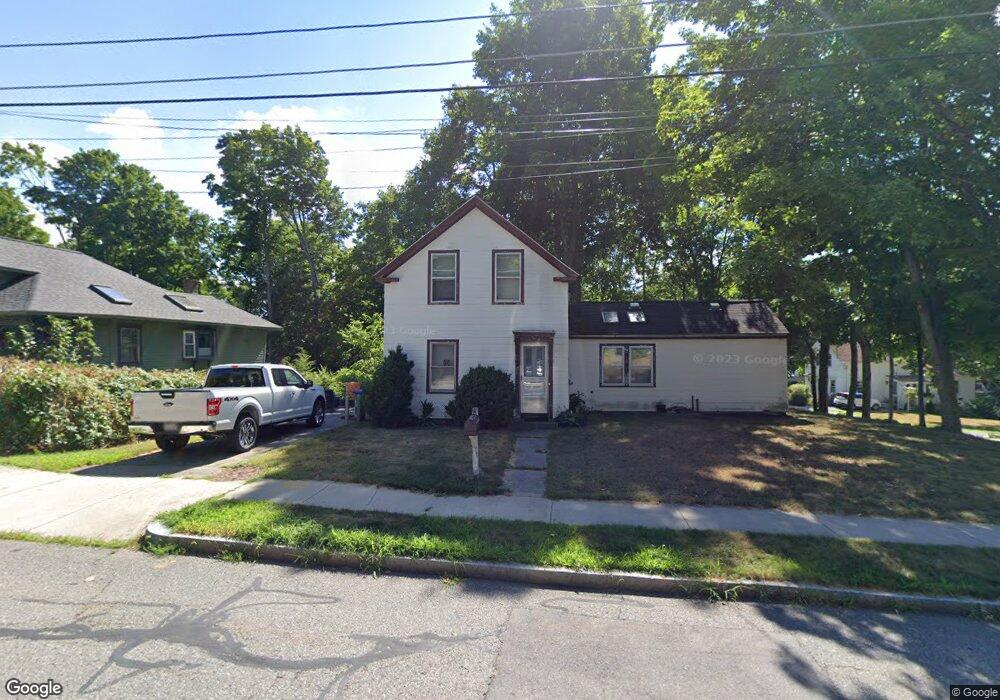
28 High St Westborough, MA 01581
Estimated Value: $620,245 - $677,000
4
Beds
3
Baths
1,472
Sq Ft
$438/Sq Ft
Est. Value
About This Home
This home is located at 28 High St, Westborough, MA 01581 and is currently estimated at $644,061, approximately $437 per square foot. 28 High St is a home located in Worcester County with nearby schools including Westborough High School, Ebridge Montessori School, and Westboro Knowledge Beginnings.
Ownership History
Date
Name
Owned For
Owner Type
Purchase Details
Closed on
Jul 1, 1998
Sold by
Connor Lorraine P and Forand Eleanor L
Bought by
Burnham Richard A
Current Estimated Value
Home Financials for this Owner
Home Financials are based on the most recent Mortgage that was taken out on this home.
Original Mortgage
$141,000
Outstanding Balance
$28,955
Interest Rate
7.04%
Mortgage Type
VA
Estimated Equity
$615,106
Purchase Details
Closed on
Feb 28, 1995
Sold by
Hall Stephen L and Hall Allison
Bought by
Connor Lorraine
Home Financials for this Owner
Home Financials are based on the most recent Mortgage that was taken out on this home.
Original Mortgage
$25,000
Interest Rate
9.17%
Mortgage Type
Purchase Money Mortgage
Purchase Details
Closed on
Dec 15, 1993
Sold by
Haney Stanley F and Haney Paula
Bought by
Hall Stephen L and Hall Allison
Create a Home Valuation Report for This Property
The Home Valuation Report is an in-depth analysis detailing your home's value as well as a comparison with similar homes in the area
Home Values in the Area
Average Home Value in this Area
Purchase History
| Date | Buyer | Sale Price | Title Company |
|---|---|---|---|
| Burnham Richard A | $141,000 | -- | |
| Connor Lorraine | $158,000 | -- | |
| Hall Stephen L | $136,500 | -- |
Source: Public Records
Mortgage History
| Date | Status | Borrower | Loan Amount |
|---|---|---|---|
| Open | Hall Stephen L | $24,000 | |
| Open | Hall Stephen L | $141,000 | |
| Previous Owner | Hall Stephen L | $50,000 | |
| Previous Owner | Hall Stephen L | $25,000 |
Source: Public Records
Tax History Compared to Growth
Tax History
| Year | Tax Paid | Tax Assessment Tax Assessment Total Assessment is a certain percentage of the fair market value that is determined by local assessors to be the total taxable value of land and additions on the property. | Land | Improvement |
|---|---|---|---|---|
| 2025 | $7,560 | $464,100 | $287,200 | $176,900 |
| 2024 | $7,112 | $433,400 | $267,000 | $166,400 |
| 2023 | $6,768 | $401,900 | $249,700 | $152,200 |
| 2022 | $6,229 | $336,900 | $200,500 | $136,400 |
| 2021 | $6,205 | $334,700 | $198,300 | $136,400 |
| 2020 | $5,857 | $319,700 | $187,300 | $132,400 |
| 2019 | $5,840 | $318,600 | $180,000 | $138,600 |
| 2018 | $5,091 | $275,800 | $165,300 | $110,500 |
| 2017 | $4,909 | $275,800 | $165,300 | $110,500 |
| 2016 | $4,826 | $271,600 | $165,300 | $106,300 |
| 2015 | $4,993 | $268,600 | $165,300 | $103,300 |
Source: Public Records
Map
Nearby Homes
- 7 Mayberry Dr Unit H
- 9 Mayberry Dr Unit 1
- 8 Mayberry Dr Unit 5
- 14C Mayberry Dr Unit 1
- 14 Grove St Unit 2
- 14 Grove St Unit 3
- 43 Church St
- 18 Church St
- 44 South St
- 8 West St
- 19 Fisher St
- 6 Folly Ln
- 19 Treetop Park Unit 19
- 9 Treetop Park
- 21 Sheffield Way
- 75 South St
- 15 Beach St
- 52 Treetop Park Unit 52
- 9 Shaker Way
- 147 Milk St Unit 8