28 Highland Meadows Cir Unit 2 Highland Heights, KY 41076
Estimated Value: $157,000 - $174,000
2
Beds
2
Baths
1,081
Sq Ft
$154/Sq Ft
Est. Value
About This Home
This home is located at 28 Highland Meadows Cir Unit 2, Highland Heights, KY 41076 and is currently estimated at $166,307, approximately $153 per square foot. 28 Highland Meadows Cir Unit 2 is a home located in Campbell County with nearby schools including Donald E. Cline Elementary School, Campbell County Middle School, and Campbell County High School.
Ownership History
Date
Name
Owned For
Owner Type
Purchase Details
Closed on
Sep 17, 2015
Sold by
Moore Amanda Guttridge and Moore Michael T
Bought by
Reed Lorraine
Current Estimated Value
Home Financials for this Owner
Home Financials are based on the most recent Mortgage that was taken out on this home.
Original Mortgage
$63,920
Outstanding Balance
$50,256
Interest Rate
3.94%
Mortgage Type
New Conventional
Estimated Equity
$116,051
Purchase Details
Closed on
Feb 26, 2010
Sold by
Mcmannon Charles R
Bought by
Guttridge Amanda C
Home Financials for this Owner
Home Financials are based on the most recent Mortgage that was taken out on this home.
Original Mortgage
$83,460
Interest Rate
5.5%
Mortgage Type
FHA
Purchase Details
Closed on
Dec 3, 2004
Sold by
Nurnberger Sue E and Scheid Sharon M
Bought by
Mcmannon Charles R and Mcmannon Dorothy R
Purchase Details
Closed on
Jul 10, 1998
Sold by
New Joanne
Bought by
Nurnberger Sue E
Create a Home Valuation Report for This Property
The Home Valuation Report is an in-depth analysis detailing your home's value as well as a comparison with similar homes in the area
Home Values in the Area
Average Home Value in this Area
Purchase History
| Date | Buyer | Sale Price | Title Company |
|---|---|---|---|
| Reed Lorraine | $79,900 | 360 American Title Svcs Llc | |
| Guttridge Amanda C | $85,000 | Lawyers Title Of Cincinnati | |
| Mcmannon Charles R | $87,000 | -- | |
| Nurnberger Sue E | $73,900 | -- |
Source: Public Records
Mortgage History
| Date | Status | Borrower | Loan Amount |
|---|---|---|---|
| Open | Reed Lorraine | $63,920 | |
| Previous Owner | Guttridge Amanda C | $83,460 |
Source: Public Records
Tax History Compared to Growth
Tax History
| Year | Tax Paid | Tax Assessment Tax Assessment Total Assessment is a certain percentage of the fair market value that is determined by local assessors to be the total taxable value of land and additions on the property. | Land | Improvement |
|---|---|---|---|---|
| 2024 | $1,327 | $108,100 | $0 | $108,100 |
| 2023 | $1,297 | $108,100 | $0 | $108,100 |
| 2022 | $1,196 | $91,900 | $0 | $91,900 |
| 2021 | $1,196 | $91,900 | $0 | $91,900 |
| 2020 | $1,208 | $91,900 | $0 | $91,900 |
| 2019 | $1,042 | $79,900 | $0 | $79,900 |
| 2018 | $1,049 | $79,900 | $0 | $79,900 |
| 2017 | $1,035 | $79,900 | $0 | $79,900 |
| 2016 | $998 | $79,900 | $0 | $0 |
| 2015 | $1,075 | $85,000 | $0 | $0 |
| 2014 | $1,049 | $85,000 | $0 | $0 |
Source: Public Records
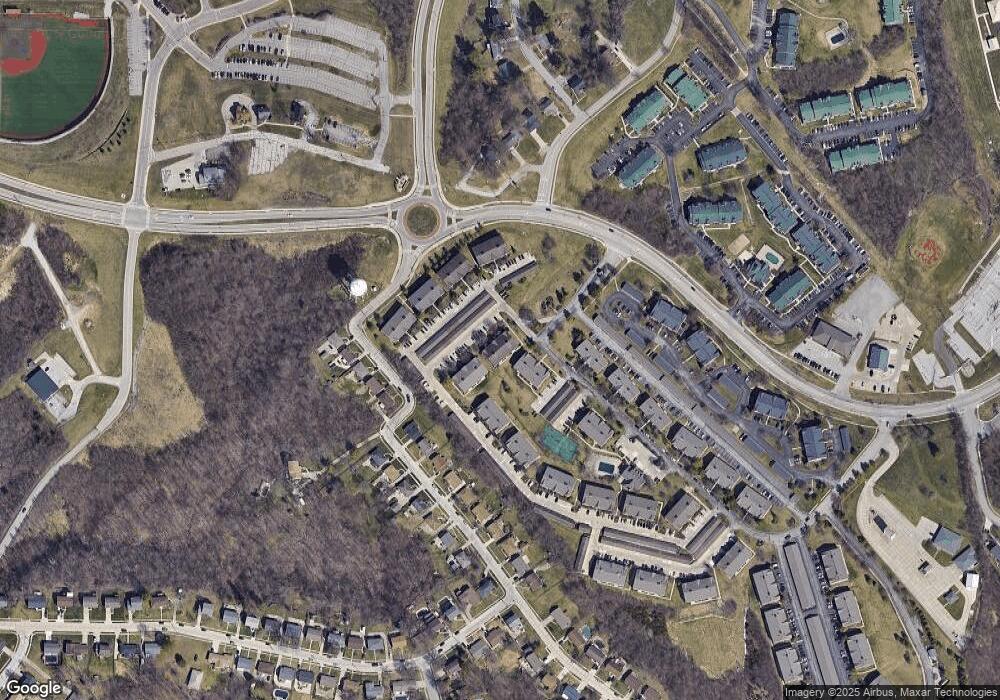
Map
Nearby Homes
- 29 Highland Meadows Cir Unit 7
- 32 Highland Meadows Cir Unit 2
- 22 Highland Meadows Cir Unit 10
- 15 Meadow Ln Unit 11
- 2 Malibu Dr
- 126 Ridge Hill Dr
- 344 Deepwoods Dr
- 387 Deepwoods Dr
- 377 Deepwoods Dr
- 546 Fawn Run Dr
- 1002 Monterey Ln
- 208 Ridge Hill Dr
- 495 Pooles Creek Rd
- 233 Sunset Dr
- 98 Bon Jan Ln
- 0 Rd
- 0 Stevens Hill Lot #4 Rd
- 0 Stevens Hill Lot #5 Rd
- 0 Stevens Hill Lot #3 Rd
- 109 Stonyridge Drive Lot #7
- 28 Highland Meadows Cir Unit 8
- 28 Highland Meadows Cir Unit 7
- 28 Highland Meadows Cir Unit 6
- 28 Highland Meadows Cir Unit 10
- 28 Highland Meadows Cir Unit 5
- 28 Highland Meadows Cir Unit 1
- 28 Highland Meadows Cir Unit 9
- 28 Highland Meadows Cir Unit 3
- 28 Highland Meadows Cir Unit 11
- 28 Highland Meadows Cir Unit 12
- 28 Highland Meadows Cir Unit 4
- 28 Highland Meadows Cir
- 28 Highland Meadows Dr Unit 28-8
- 28 Highland Meadows Dr Unit 7
- 28 Highland Meadows Dr Unit 28-9
- 28 Highland Meadows Dr Unit 9
- 28 Highland Meadows Dr
- 28 Highland Meadows Dr Unit 1
- 28 Highland Meadows Dr Unit 6
- 28 Highland Meadows Circle #12