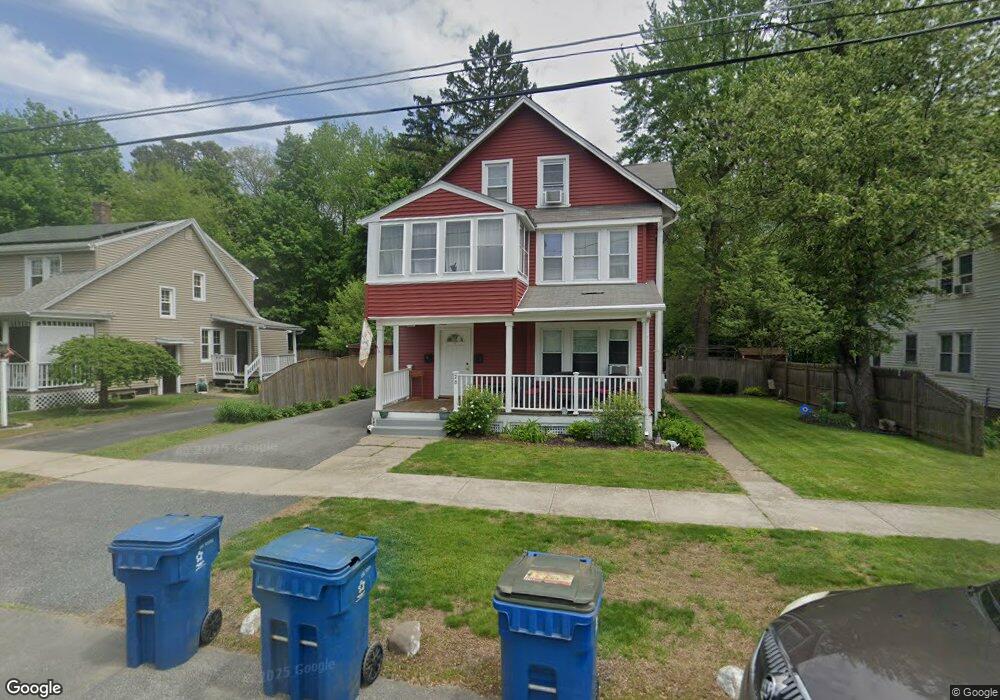
28 Janet St West Springfield, MA 01089
Estimated Value: $350,898 - $406,000
6
Beds
2
Baths
2,274
Sq Ft
$167/Sq Ft
Est. Value
About This Home
This home is located at 28 Janet St, West Springfield, MA 01089 and is currently estimated at $380,475, approximately $167 per square foot. 28 Janet St is a home located in Hampden County with nearby schools including St Thomas The Apostle School.
Ownership History
Date
Name
Owned For
Owner Type
Purchase Details
Closed on
Apr 30, 2001
Sold by
Despirt Santo C and Despirt Laura M
Bought by
Page Kathryn E
Current Estimated Value
Home Financials for this Owner
Home Financials are based on the most recent Mortgage that was taken out on this home.
Original Mortgage
$123,424
Interest Rate
6.88%
Mortgage Type
Purchase Money Mortgage
Purchase Details
Closed on
May 1, 1989
Sold by
Fullam Shirley
Bought by
Despirt Santo C
Home Financials for this Owner
Home Financials are based on the most recent Mortgage that was taken out on this home.
Original Mortgage
$132,300
Interest Rate
10.9%
Mortgage Type
Purchase Money Mortgage
Create a Home Valuation Report for This Property
The Home Valuation Report is an in-depth analysis detailing your home's value as well as a comparison with similar homes in the area
Home Values in the Area
Average Home Value in this Area
Purchase History
| Date | Buyer | Sale Price | Title Company |
|---|---|---|---|
| Page Kathryn E | $128,000 | -- | |
| Despirt Santo C | $147,000 | -- |
Source: Public Records
Mortgage History
| Date | Status | Borrower | Loan Amount |
|---|---|---|---|
| Open | Despirt Santo C | $129,000 | |
| Closed | Despirt Santo C | $123,424 | |
| Previous Owner | Despirt Santo C | $132,300 |
Source: Public Records
Tax History Compared to Growth
Tax History
| Year | Tax Paid | Tax Assessment Tax Assessment Total Assessment is a certain percentage of the fair market value that is determined by local assessors to be the total taxable value of land and additions on the property. | Land | Improvement |
|---|---|---|---|---|
| 2025 | $4,283 | $288,000 | $106,200 | $181,800 |
| 2024 | $4,265 | $288,000 | $106,200 | $181,800 |
| 2023 | $3,966 | $255,200 | $106,200 | $149,000 |
| 2022 | $3,868 | $245,400 | $96,400 | $149,000 |
| 2021 | $3,361 | $198,900 | $87,800 | $111,100 |
| 2020 | $3,374 | $198,600 | $87,800 | $110,800 |
| 2019 | $3,368 | $198,600 | $87,800 | $110,800 |
| 2018 | $3,311 | $194,200 | $87,800 | $106,400 |
| 2017 | $3,311 | $194,200 | $87,800 | $106,400 |
| 2016 | $3,242 | $190,800 | $84,400 | $106,400 |
| 2015 | $3,179 | $187,100 | $82,800 | $104,300 |
| 2014 | $771 | $187,100 | $82,800 | $104,300 |
Source: Public Records
Map
Nearby Homes