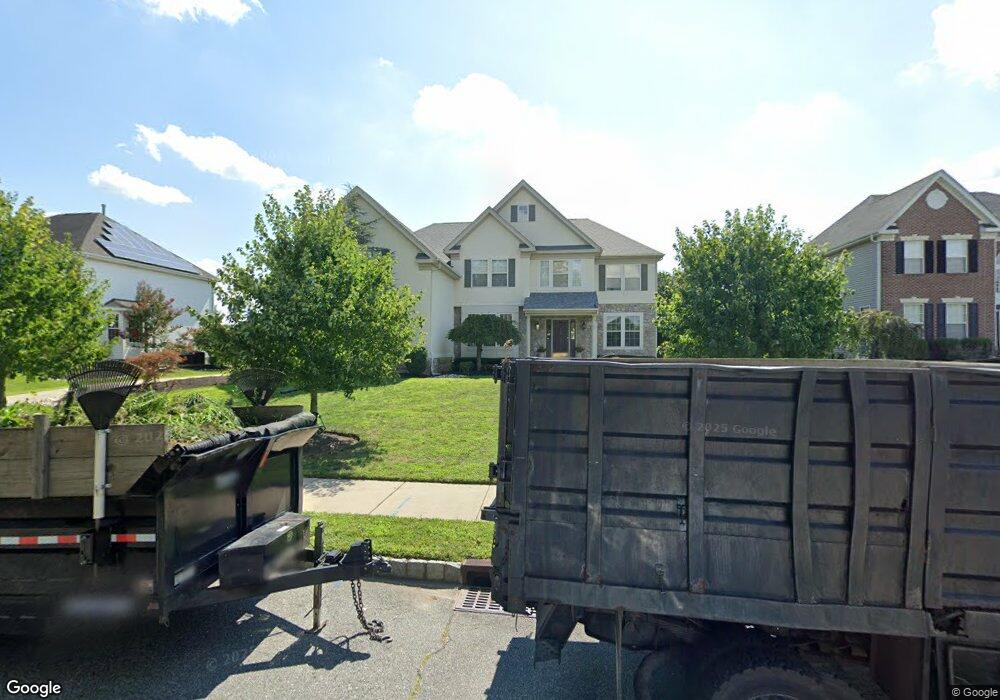
28 Jasmine Rd Lumberton, NJ 08048
Estimated Value: $874,838 - $1,014,000
--
Bed
--
Bath
3,700
Sq Ft
$254/Sq Ft
Est. Value
About This Home
This home is located at 28 Jasmine Rd, Lumberton, NJ 08048 and is currently estimated at $941,460, approximately $254 per square foot. 28 Jasmine Rd is a home located in Burlington County with nearby schools including Ashbrook Elementary School, Bobby’s Run School, and Lumberton Middle School.
Ownership History
Date
Name
Owned For
Owner Type
Purchase Details
Closed on
May 1, 2003
Sold by
Orleans Corp
Bought by
Minghenelli Michael S and Minghenelli Lisa M
Current Estimated Value
Home Financials for this Owner
Home Financials are based on the most recent Mortgage that was taken out on this home.
Original Mortgage
$389,858
Interest Rate
5.46%
Mortgage Type
Stand Alone First
Create a Home Valuation Report for This Property
The Home Valuation Report is an in-depth analysis detailing your home's value as well as a comparison with similar homes in the area
Home Values in the Area
Average Home Value in this Area
Purchase History
| Date | Buyer | Sale Price | Title Company |
|---|---|---|---|
| Minghenelli Michael S | $487,323 | -- | |
| -- | $487,300 | -- |
Source: Public Records
Mortgage History
| Date | Status | Borrower | Loan Amount |
|---|---|---|---|
| Previous Owner | -- | $389,858 |
Source: Public Records
Tax History Compared to Growth
Tax History
| Year | Tax Paid | Tax Assessment Tax Assessment Total Assessment is a certain percentage of the fair market value that is determined by local assessors to be the total taxable value of land and additions on the property. | Land | Improvement |
|---|---|---|---|---|
| 2025 | $13,976 | $525,000 | $96,200 | $428,800 |
| 2024 | $13,141 | $525,000 | $96,200 | $428,800 |
| 2023 | $13,141 | $525,000 | $96,200 | $428,800 |
| 2022 | $12,836 | $525,000 | $96,200 | $428,800 |
| 2021 | $12,800 | $525,000 | $96,200 | $428,800 |
| 2020 | $14,712 | $608,700 | $96,200 | $512,500 |
| 2019 | $14,548 | $608,700 | $96,200 | $512,500 |
| 2018 | $14,329 | $608,700 | $96,200 | $512,500 |
| 2017 | $14,061 | $608,700 | $96,200 | $512,500 |
| 2016 | $13,757 | $608,700 | $96,200 | $512,500 |
| 2015 | $13,653 | $608,700 | $96,200 | $512,500 |
| 2014 | $13,136 | $608,700 | $96,200 | $512,500 |
Source: Public Records
Map
Nearby Homes
- 20 Jasmine Rd
- 485 Main St
- 23 Creek Rd
- 587 Main St
- 11 Stirling Way
- 12 Bancroft Ln
- 10 Whitehaven Dr
- 4 Black Pine Ln
- 71 Kingsbridge Dr
- 11 Tyler Place
- 1476 Route 38 Unit 8
- 18 Westminster Dr
- 105 Stonebrook Dr
- 5 Quaker Ct
- 49 Nassau Rd
- 210 Royal Ave
- 2 Providence Ct
- 414 Bischoff Ave
- 39 Tynemouth Dr
- 11 Abington Way