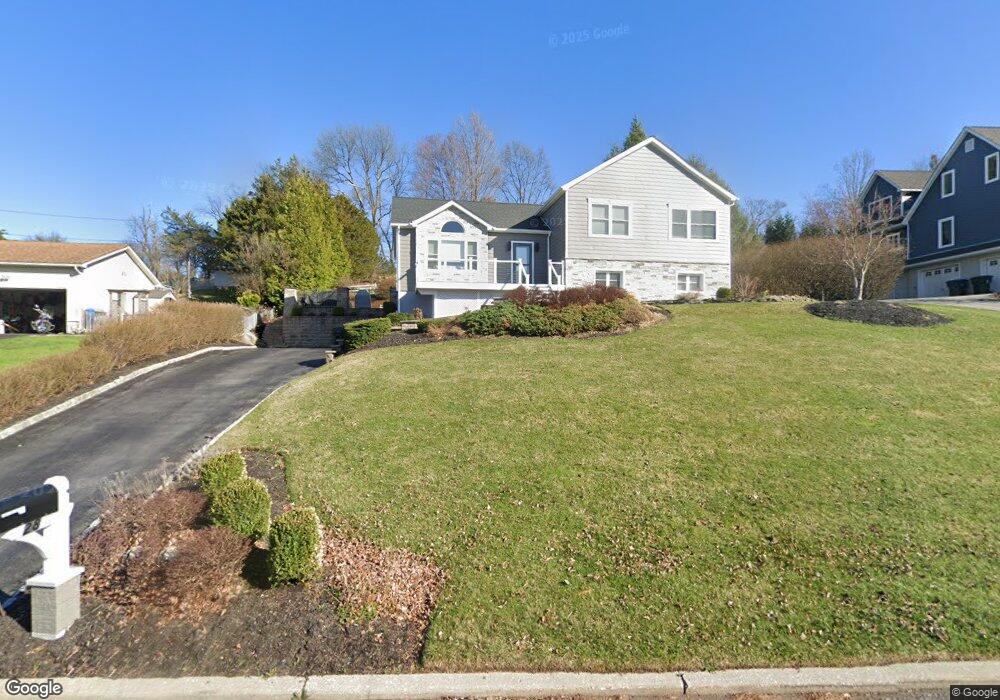
28 Jeffrey Dr Chester, NY 10918
Estimated Value: $574,253 - $648,000
4
Beds
3
Baths
1,570
Sq Ft
$380/Sq Ft
Est. Value
About This Home
This home is located at 28 Jeffrey Dr, Chester, NY 10918 and is currently estimated at $597,063, approximately $380 per square foot. 28 Jeffrey Dr is a home located in Orange County with nearby schools including Warwick Valley Middle School and Warwick Valley High School.
Ownership History
Date
Name
Owned For
Owner Type
Purchase Details
Closed on
May 21, 2020
Sold by
Godwin Arthur S and Godwin Michele
Bought by
Godwin Arthur S
Current Estimated Value
Purchase Details
Closed on
Jul 29, 2019
Sold by
Reilly Deborah O
Bought by
Deborah A Oreilly Lt and Oreilly
Purchase Details
Closed on
Jun 2, 2015
Sold by
Oreilly Family Irrevoc Trust
Bought by
O'Reilly Deborah
Home Financials for this Owner
Home Financials are based on the most recent Mortgage that was taken out on this home.
Original Mortgage
$220,000
Interest Rate
3.84%
Mortgage Type
New Conventional
Purchase Details
Closed on
Sep 13, 2010
Sold by
Oreilly Kevin
Bought by
O'Reilly Kevin
Purchase Details
Closed on
Jan 23, 1998
Sold by
Monteleone Michael J and Monteleone Veronika M
Bought by
Oreilly Kevin and Oreilly Deborah
Create a Home Valuation Report for This Property
The Home Valuation Report is an in-depth analysis detailing your home's value as well as a comparison with similar homes in the area
Home Values in the Area
Average Home Value in this Area
Purchase History
| Date | Buyer | Sale Price | Title Company |
|---|---|---|---|
| Godwin Arthur S | -- | None Available | |
| Deborah A Oreilly Lt | -- | -- | |
| O'Reilly Deborah | $300,000 | Barbara Strauss | |
| O'Reilly Kevin | -- | Ronald J Cohen | |
| Oreilly Kevin | $184,000 | -- |
Source: Public Records
Mortgage History
| Date | Status | Borrower | Loan Amount |
|---|---|---|---|
| Previous Owner | O'Reilly Deborah | $220,000 |
Source: Public Records
Tax History Compared to Growth
Tax History
| Year | Tax Paid | Tax Assessment Tax Assessment Total Assessment is a certain percentage of the fair market value that is determined by local assessors to be the total taxable value of land and additions on the property. | Land | Improvement |
|---|---|---|---|---|
| 2024 | $10,580 | $168,500 | $44,300 | $124,200 |
| 2023 | $10,580 | $168,500 | $44,300 | $124,200 |
| 2022 | $10,140 | $168,500 | $44,300 | $124,200 |
| 2021 | $10,537 | $168,500 | $44,300 | $124,200 |
| 2020 | $10,661 | $168,500 | $44,300 | $124,200 |
| 2019 | $10,276 | $168,500 | $44,300 | $124,200 |
| 2018 | $10,276 | $168,500 | $44,300 | $124,200 |
| 2017 | $9,701 | $168,500 | $44,300 | $124,200 |
| 2016 | $9,703 | $168,500 | $44,300 | $124,200 |
| 2015 | -- | $168,500 | $44,300 | $124,200 |
| 2014 | -- | $168,500 | $44,300 | $124,200 |
Source: Public Records
Map
Nearby Homes
- 2 Dawn Ct
- 80 Pewter Cir
- 1414 Kings Hwy
- 23 Pewter Cir
- 3 Derose Ln
- 2 Pine Hill Rd
- 16 Mari Rd
- 84 Pine Hill Rd
- 32 Mountainside Dr
- 53 Odyssey Dr
- 34 Mountainside Dr
- 0 Odyssey Dr Unit KEY858370
- 69 Cedar Pond Ln
- 7 Park Place
- 23 W Meadow Way
- 219 Bull Mill Rd
- 36 Marian Ct
- 23 Marian Ct
- 467 Kings Hwy
- 6 Moffatt Ln