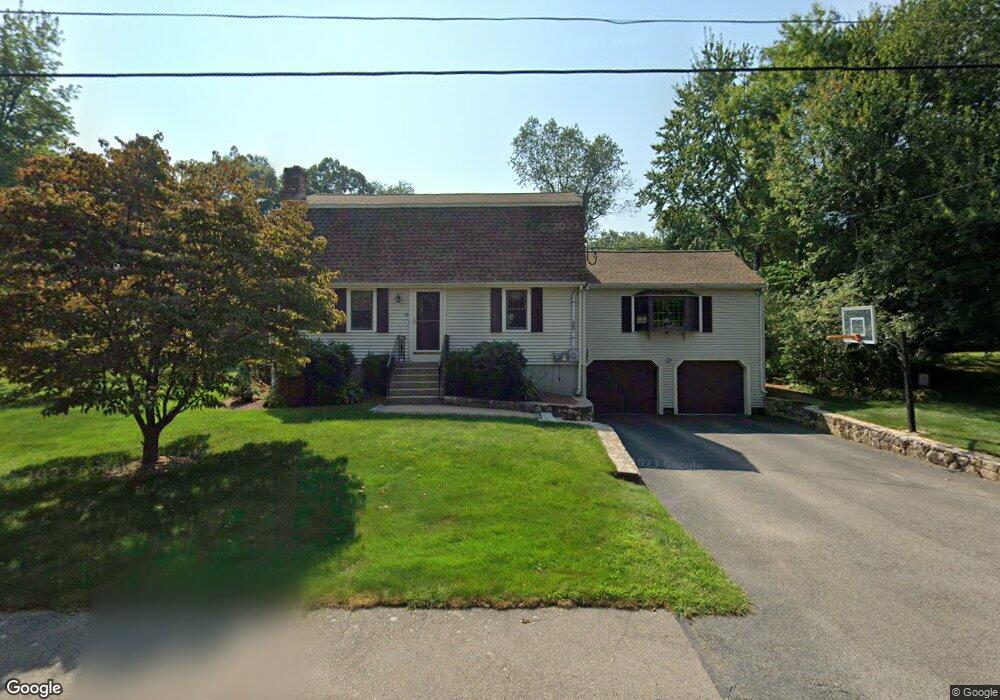
28 John Alden Cir Bellingham, MA 02019
Estimated Value: $624,801 - $783,000
4
Beds
2
Baths
2,602
Sq Ft
$263/Sq Ft
Est. Value
About This Home
This home is located at 28 John Alden Cir, Bellingham, MA 02019 and is currently estimated at $684,700, approximately $263 per square foot. 28 John Alden Cir is a home located in Norfolk County with nearby schools including Stall Brook Elementary School, Bellingham High School, and Bethany Christian Academy.
Ownership History
Date
Name
Owned For
Owner Type
Purchase Details
Closed on
Apr 6, 2023
Sold by
Firth Christopher W and Firth Diane T
Bought by
Firth Ft
Current Estimated Value
Purchase Details
Closed on
Oct 2, 1987
Sold by
Chamberlain Robert
Bought by
Firth Christopher W
Create a Home Valuation Report for This Property
The Home Valuation Report is an in-depth analysis detailing your home's value as well as a comparison with similar homes in the area
Home Values in the Area
Average Home Value in this Area
Purchase History
| Date | Buyer | Sale Price | Title Company |
|---|---|---|---|
| Firth Ft | -- | None Available | |
| Firth Christopher W | $151,900 | -- |
Source: Public Records
Mortgage History
| Date | Status | Borrower | Loan Amount |
|---|---|---|---|
| Previous Owner | Firth Christopher W | $18,000 | |
| Previous Owner | Firth Christopher W | $8,000 | |
| Previous Owner | Firth Christopher W | $124,000 | |
| Previous Owner | Firth Christopher W | $132,000 |
Source: Public Records
Tax History Compared to Growth
Tax History
| Year | Tax Paid | Tax Assessment Tax Assessment Total Assessment is a certain percentage of the fair market value that is determined by local assessors to be the total taxable value of land and additions on the property. | Land | Improvement |
|---|---|---|---|---|
| 2025 | $6,546 | $521,200 | $167,200 | $354,000 |
| 2024 | $6,290 | $489,100 | $152,700 | $336,400 |
| 2023 | $6,060 | $464,400 | $145,400 | $319,000 |
| 2022 | $5,945 | $422,200 | $121,200 | $301,000 |
| 2021 | $5,747 | $398,800 | $121,200 | $277,600 |
| 2020 | $5,449 | $383,200 | $121,200 | $262,000 |
| 2019 | $5,323 | $374,600 | $121,200 | $253,400 |
| 2018 | $5,020 | $348,400 | $116,600 | $231,800 |
| 2017 | $4,874 | $339,900 | $116,600 | $223,300 |
| 2016 | $4,626 | $323,700 | $114,600 | $209,100 |
| 2015 | $4,436 | $311,300 | $110,200 | $201,100 |
| 2014 | $4,452 | $303,700 | $107,700 | $196,000 |
Source: Public Records
Map
Nearby Homes
- 17 Pine St
- 387 Hartford Ave
- 14 Hawthorne Village Unit D
- 0 Old Log Lane (Farm St) Unit 73416329
- 455 Hartford Ave
- 462 Hartford Ave
- 18 Mary Anne Dr
- 29 Rawson Rd
- 951 Pond St
- 9 Tulip Way
- 39 West St
- 22 Granite St
- 21 Riverside Rd
- 220 Main St Unit 220
- 5 Fales St
- 60 Southgate Rd
- 22 Roger Belanger Dr
- 6 Freedom Trail
- 2 Noanet Brook Ln
- 49 Monique Dr