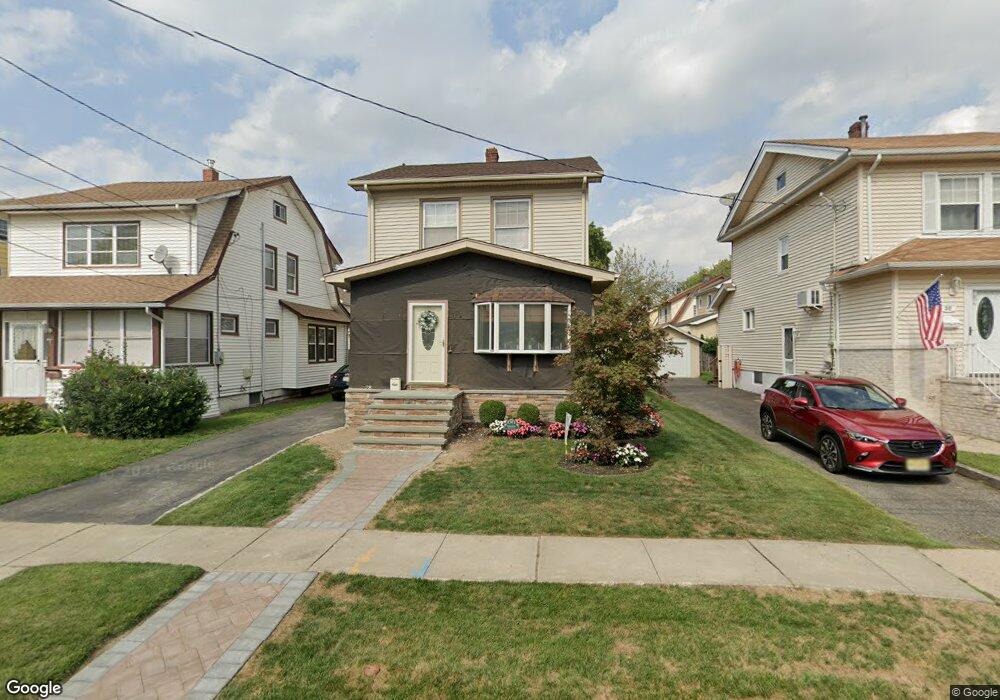
28 Johnson Ave Bloomfield, NJ 07003
Estimated Value: $576,565 - $693,000
Studio
--
Bath
1,428
Sq Ft
$443/Sq Ft
Est. Value
About This Home
This home is located at 28 Johnson Ave, Bloomfield, NJ 07003 and is currently estimated at $631,891, approximately $442 per square foot. 28 Johnson Ave is a home located in Essex County with nearby schools including Demarest School, Bloomfield Middle School, and Bloomfield High School.
Ownership History
Date
Name
Owned For
Owner Type
Purchase Details
Closed on
Sep 29, 1997
Sold by
Lipoma Joseph
Bought by
Maldonado Anibal and Maldonado Lauren
Current Estimated Value
Home Financials for this Owner
Home Financials are based on the most recent Mortgage that was taken out on this home.
Original Mortgage
$142,000
Outstanding Balance
$22,295
Interest Rate
7.19%
Estimated Equity
$609,596
Purchase Details
Closed on
Jul 27, 1992
Sold by
Lackey George and Lackey Anita
Bought by
Lipoma Joseph and Lipoma Stampe,Laura
Create a Home Valuation Report for This Property
The Home Valuation Report is an in-depth analysis detailing your home's value as well as a comparison with similar homes in the area
Home Values in the Area
Average Home Value in this Area
Purchase History
| Date | Buyer | Sale Price | Title Company |
|---|---|---|---|
| Maldonado Anibal | $149,000 | -- | |
| Lipoma Joseph | $150,000 | -- |
Source: Public Records
Mortgage History
| Date | Status | Borrower | Loan Amount |
|---|---|---|---|
| Open | Maldonado Anibal | $142,000 |
Source: Public Records
Tax History
| Year | Tax Paid | Tax Assessment Tax Assessment Total Assessment is a certain percentage of the fair market value that is determined by local assessors to be the total taxable value of land and additions on the property. | Land | Improvement |
|---|---|---|---|---|
| 2025 | $12,262 | $375,200 | $155,400 | $219,800 |
| 2024 | $12,262 | $375,200 | $155,400 | $219,800 |
| 2022 | $12,014 | $375,200 | $155,400 | $219,800 |
| 2021 | $11,793 | $375,200 | $155,400 | $219,800 |
| 2020 | $11,612 | $375,200 | $155,400 | $219,800 |
| 2019 | $11,429 | $287,100 | $139,000 | $148,100 |
| 2018 | $11,381 | $287,100 | $139,000 | $148,100 |
| 2017 | $11,208 | $287,100 | $139,000 | $148,100 |
| 2016 | $11,082 | $287,100 | $139,000 | $148,100 |
| 2015 | $10,982 | $287,100 | $139,000 | $148,100 |
| 2014 | $10,781 | $287,100 | $139,000 | $148,100 |
Source: Public Records
Map
Nearby Homes
Your Personal Tour Guide
Ask me questions while you tour the home.