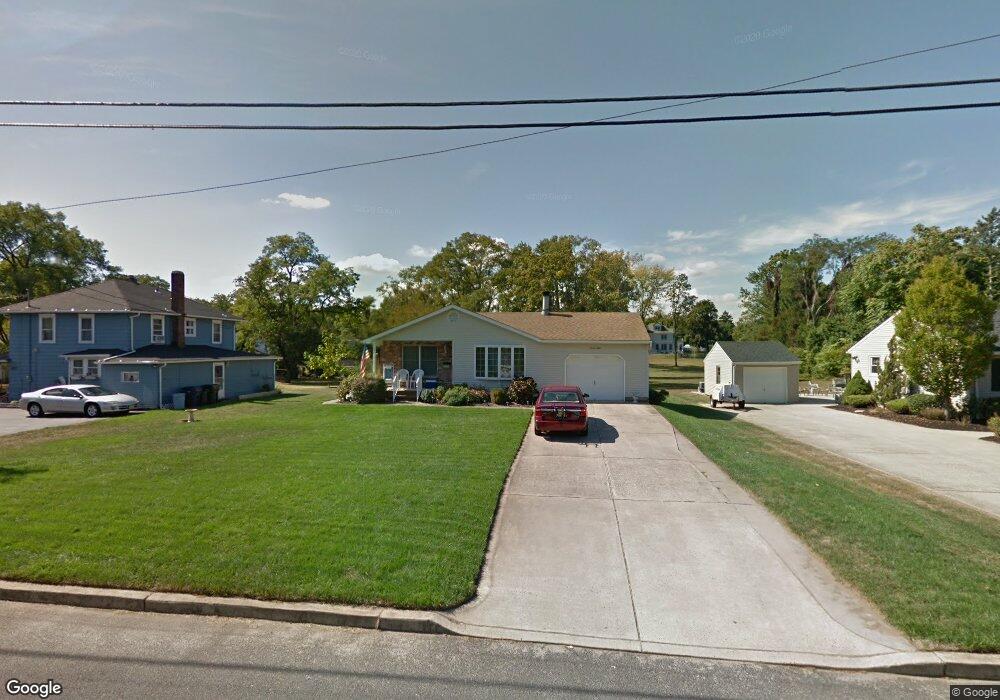
28 Johnston St Unit 5 Oakhurst, NJ 07755
Estimated Value: $970,150 - $1,101,000
2
Beds
1
Bath
2,008
Sq Ft
$508/Sq Ft
Est. Value
About This Home
This home is located at 28 Johnston St Unit 5, Oakhurst, NJ 07755 and is currently estimated at $1,021,038, approximately $508 per square foot. 28 Johnston St Unit 5 is a home located in Monmouth County with nearby schools including Ocean Township High School, Bet Yaakov of the Jersey Shore, and Ma'or Yeshiva High School for Boys.
Ownership History
Date
Name
Owned For
Owner Type
Purchase Details
Closed on
Apr 9, 2021
Sold by
401 West Park Corp
Bought by
Shlomo Mark
Current Estimated Value
Home Financials for this Owner
Home Financials are based on the most recent Mortgage that was taken out on this home.
Original Mortgage
$466,900
Outstanding Balance
$421,554
Interest Rate
3%
Mortgage Type
New Conventional
Estimated Equity
$599,484
Purchase Details
Closed on
Aug 8, 2019
Sold by
Babayoff Nathanel
Bought by
401 West Park Corp
Purchase Details
Closed on
Feb 28, 2019
Sold by
Wood Douglas X and Wood Elizabeth A
Bought by
Babayoff Nathanel
Home Financials for this Owner
Home Financials are based on the most recent Mortgage that was taken out on this home.
Original Mortgage
$198,750
Interest Rate
4.4%
Mortgage Type
Commercial
Create a Home Valuation Report for This Property
The Home Valuation Report is an in-depth analysis detailing your home's value as well as a comparison with similar homes in the area
Home Values in the Area
Average Home Value in this Area
Purchase History
| Date | Buyer | Sale Price | Title Company |
|---|---|---|---|
| Shlomo Mark | $667,000 | Madison Title Agency Llc | |
| Shlomo Mark | $667,000 | Land Title | |
| 401 West Park Corp | $300,000 | Madison Title Agency Llc | |
| Babayoff Nathanel | $265,000 | Madison Title Agency Llc |
Source: Public Records
Mortgage History
| Date | Status | Borrower | Loan Amount |
|---|---|---|---|
| Open | Shlomo Mark | $466,900 | |
| Closed | Shlomo Mark | $466,900 | |
| Previous Owner | Babayoff Nathanel | $198,750 |
Source: Public Records
Tax History Compared to Growth
Tax History
| Year | Tax Paid | Tax Assessment Tax Assessment Total Assessment is a certain percentage of the fair market value that is determined by local assessors to be the total taxable value of land and additions on the property. | Land | Improvement |
|---|---|---|---|---|
| 2025 | $11,243 | $849,500 | $575,700 | $273,800 |
| 2024 | $12,367 | $788,400 | $537,700 | $250,700 |
| 2023 | $12,367 | $808,800 | $662,900 | $145,900 |
| 2022 | $7,801 | $487,500 | $348,600 | $138,900 |
| 2021 | $7,801 | $397,000 | $271,100 | $125,900 |
| 2020 | $8,446 | $424,200 | $271,100 | $153,100 |
| 2019 | $8,274 | $405,800 | $253,600 | $152,200 |
| 2018 | $7,469 | $356,700 | $198,600 | $158,100 |
| 2017 | $7,529 | $358,000 | $208,600 | $149,400 |
| 2016 | $6,638 | $283,900 | $178,600 | $105,300 |
| 2015 | $6,955 | $301,200 | $198,600 | $102,600 |
| 2014 | $6,866 | $301,400 | $198,600 | $102,800 |
Source: Public Records
Map
Nearby Homes
- 28 Johnston St
- 26 Johnston St
- 24 Johnston St
- 405 W Park Ave
- 30 Johnston St
- 25 Johnston St
- 411 W Park Ave
- 20 Johnston St
- 23 Johnston St
- 399 W Park Ave Unit 2
- 399 W Park Ave Unit 1
- 399 W Park Ave
- 21 Johnston St
- 419 W Park Ave
- 395 W Park Ave
- 19 Johnston St
- 18 Johnston St
- 7 Robin Dr
- 404 W Park Ave
- 5 Robin Dr