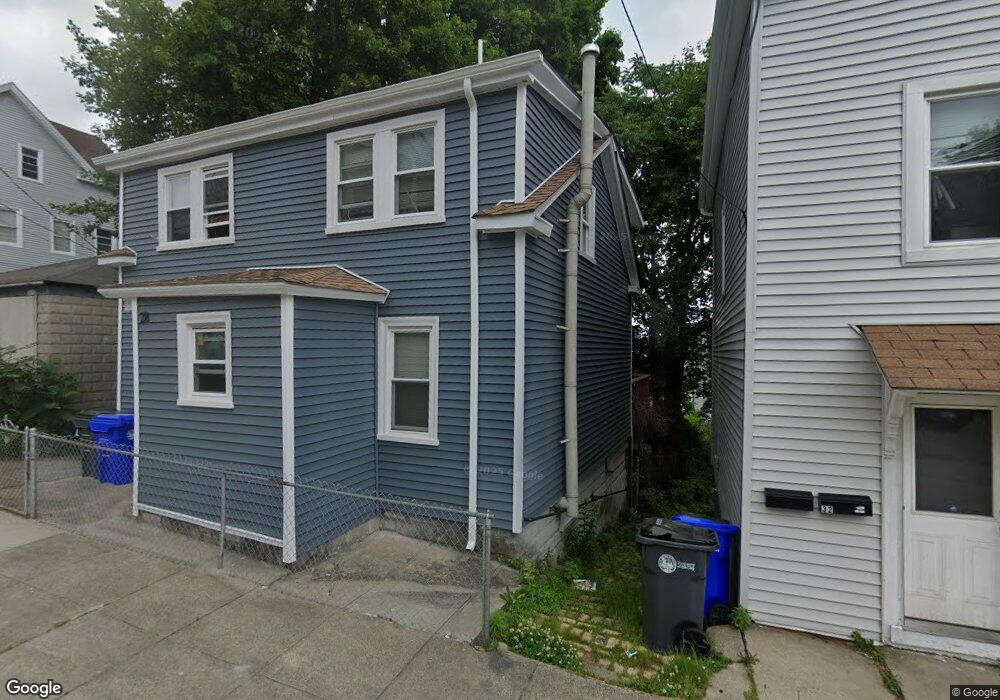
28 Judith St Providence, RI 02909
Silver Lake NeighborhoodEstimated Value: $338,000 - $386,000
3
Beds
2
Baths
1,260
Sq Ft
$283/Sq Ft
Est. Value
About This Home
This home is located at 28 Judith St, Providence, RI 02909 and is currently estimated at $356,862, approximately $283 per square foot. 28 Judith St is a home located in Providence County with nearby schools including Achievement First Promesa, Achievement First Providence Mayoral Academy Elementary, and Paul Cuffee Middle School.
Ownership History
Date
Name
Owned For
Owner Type
Purchase Details
Closed on
Dec 15, 2008
Sold by
Deutsche Bk
Bought by
Larrain Luthy
Current Estimated Value
Purchase Details
Closed on
Sep 4, 2008
Sold by
Lantigua Andrea L and Lantigua Edwin R
Bought by
Deutsche Bank Natl T C
Purchase Details
Closed on
Nov 2, 2005
Sold by
Alfaia Carlos
Bought by
Arroyo Andrea L
Home Financials for this Owner
Home Financials are based on the most recent Mortgage that was taken out on this home.
Original Mortgage
$114,000
Interest Rate
5.85%
Mortgage Type
Purchase Money Mortgage
Purchase Details
Closed on
Aug 13, 2002
Sold by
Cabrera Ramon and Delarosa Jose
Bought by
Fernandez Elias
Create a Home Valuation Report for This Property
The Home Valuation Report is an in-depth analysis detailing your home's value as well as a comparison with similar homes in the area
Home Values in the Area
Average Home Value in this Area
Purchase History
| Date | Buyer | Sale Price | Title Company |
|---|---|---|---|
| Larrain Luthy | $29,000 | -- | |
| Deutsche Bank Natl T C | $128,350 | -- | |
| Arroyo Andrea L | $145,000 | -- | |
| Fernandez Elias | $115,000 | -- |
Source: Public Records
Mortgage History
| Date | Status | Borrower | Loan Amount |
|---|---|---|---|
| Open | Fernandez Elias | $50,000 | |
| Previous Owner | Fernandez Elias | $114,000 | |
| Previous Owner | Fernandez Elias | $29,000 |
Source: Public Records
Tax History
| Year | Tax Paid | Tax Assessment Tax Assessment Total Assessment is a certain percentage of the fair market value that is determined by local assessors to be the total taxable value of land and additions on the property. | Land | Improvement |
|---|---|---|---|---|
| 2025 | $2,706 | $322,200 | $126,700 | $195,500 |
| 2024 | $4,046 | $220,500 | $71,300 | $149,200 |
| 2023 | $4,046 | $220,500 | $71,300 | $149,200 |
| 2022 | $3,925 | $220,500 | $71,300 | $149,200 |
| 2021 | $2,967 | $120,800 | $45,200 | $75,600 |
| 2020 | $2,967 | $120,800 | $45,200 | $75,600 |
| 2019 | $2,967 | $120,800 | $45,200 | $75,600 |
| 2018 | $3,634 | $113,700 | $43,900 | $69,800 |
| 2017 | $3,634 | $113,700 | $43,900 | $69,800 |
| 2016 | $3,634 | $113,700 | $43,900 | $69,800 |
| 2015 | $3,194 | $96,500 | $46,600 | $49,900 |
| 2014 | $3,257 | $96,500 | $46,600 | $49,900 |
| 2013 | $3,257 | $96,500 | $46,600 | $49,900 |
Source: Public Records
Map
Nearby Homes
Your Personal Tour Guide
Ask me questions while you tour the home.