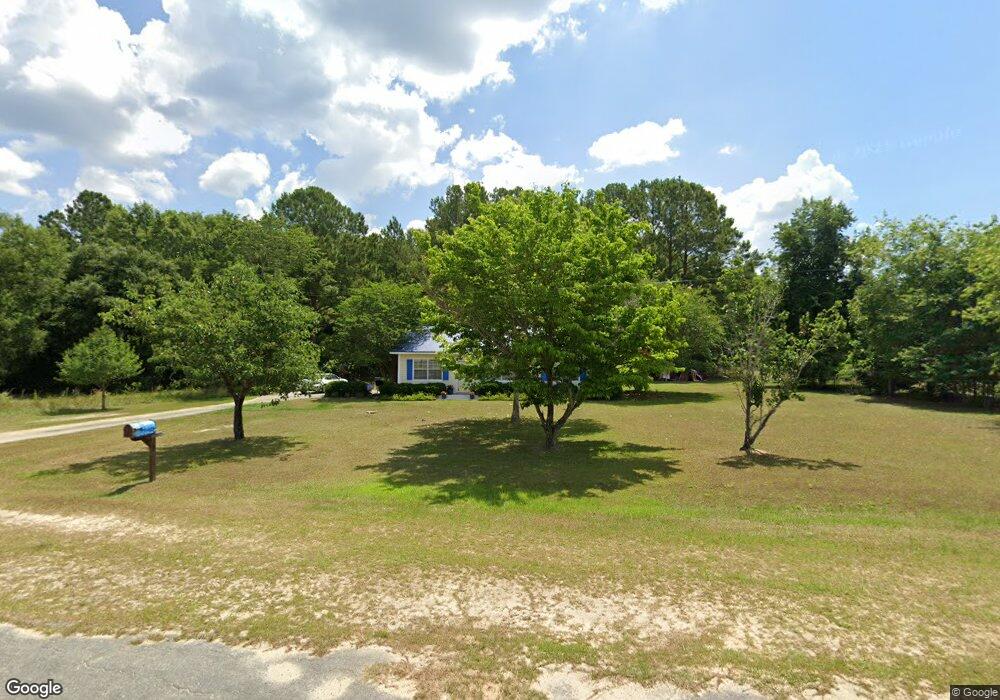
28 K St Hazlehurst, GA 31539
Estimated Value: $108,654 - $138,000
2
Beds
2
Baths
960
Sq Ft
$126/Sq Ft
Est. Value
About This Home
This home is located at 28 K St, Hazlehurst, GA 31539 and is currently estimated at $120,664, approximately $125 per square foot. 28 K St is a home located in Jeff Davis County with nearby schools including Jeff Davis Primary School, Jeff Davis Elementary School, and Jeff Davis Middle School.
Ownership History
Date
Name
Owned For
Owner Type
Purchase Details
Closed on
Jul 24, 2014
Sold by
Lawson John B
Bought by
Leggett Susan G
Current Estimated Value
Home Financials for this Owner
Home Financials are based on the most recent Mortgage that was taken out on this home.
Original Mortgage
$45,355
Outstanding Balance
$36,283
Interest Rate
4.19%
Mortgage Type
New Conventional
Estimated Equity
$84,382
Purchase Details
Closed on
Jun 1, 2010
Sold by
Lawson Jason B
Bought by
Lawson John B
Home Financials for this Owner
Home Financials are based on the most recent Mortgage that was taken out on this home.
Original Mortgage
$51,300
Interest Rate
4.97%
Mortgage Type
New Conventional
Purchase Details
Closed on
Jun 1, 2001
Sold by
Goodman Peggy D
Bought by
Lawson Jason B
Purchase Details
Closed on
Oct 24, 1989
Bought by
Goodman Peggy D
Purchase Details
Closed on
Jan 1, 1984
Bought by
Robertson Ricky W
Create a Home Valuation Report for This Property
The Home Valuation Report is an in-depth analysis detailing your home's value as well as a comparison with similar homes in the area
Home Values in the Area
Average Home Value in this Area
Purchase History
| Date | Buyer | Sale Price | Title Company |
|---|---|---|---|
| Leggett Susan G | $52,000 | -- | |
| Lawson John B | $54,000 | -- | |
| Lawson Jason B | $52,500 | -- | |
| Goodman Peggy D | $32,000 | -- | |
| Robertson Ricky W | $33,000 | -- |
Source: Public Records
Mortgage History
| Date | Status | Borrower | Loan Amount |
|---|---|---|---|
| Open | Leggett Susan G | $45,355 | |
| Previous Owner | Lawson John B | $51,300 |
Source: Public Records
Tax History Compared to Growth
Tax History
| Year | Tax Paid | Tax Assessment Tax Assessment Total Assessment is a certain percentage of the fair market value that is determined by local assessors to be the total taxable value of land and additions on the property. | Land | Improvement |
|---|---|---|---|---|
| 2024 | $1,169 | $32,840 | $2,600 | $30,240 |
| 2023 | $619 | $18,140 | $2,600 | $15,540 |
| 2022 | $619 | $18,140 | $2,600 | $15,540 |
| 2021 | $619 | $18,140 | $2,600 | $15,540 |
| 2020 | $619 | $18,140 | $2,600 | $15,540 |
| 2019 | $603 | $18,140 | $2,600 | $15,540 |
| 2018 | $619 | $18,140 | $2,600 | $15,540 |
| 2017 | $472 | $18,358 | $2,600 | $15,758 |
| 2016 | $464 | $18,358 | $2,600 | $15,758 |
| 2015 | -- | $18,358 | $2,600 | $15,758 |
| 2014 | -- | $17,341 | $2,600 | $14,741 |
Source: Public Records
Map
Nearby Homes
- 6 Lynnwood Dr
- 45 Elton St
- 116 Walton Way
- 0 Charles Rogers Blvd
- 4 Lakeside Dr
- 44 Kersey St
- 17 Young St
- 73 Latimer St
- 27 Park Ln
- 19 Martin Luther King jr Blvd
- 20 W Sycamore St
- 10 W 1st Ave
- 39 N Tallahassee St
- 00 N Tallahassee St
- 371 Burketts Ferry Rd
- 104 N Tallahassee St
- 0 Collins St
- 16 Beech Rd
- 142 N Tallahassee St
- 95 E Plum St