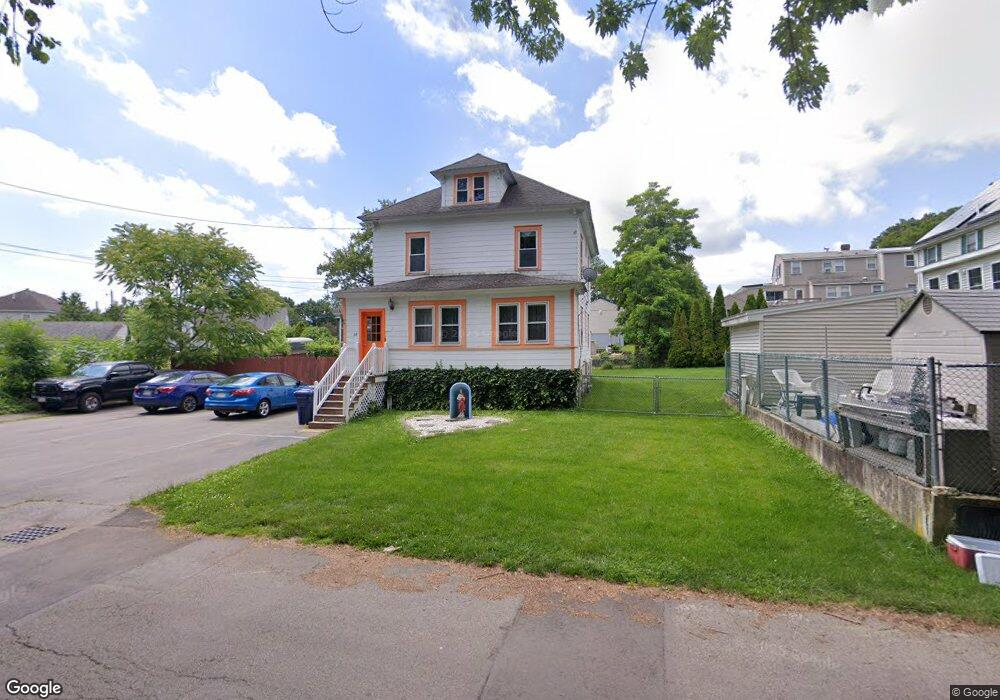
28 Kent St Dracut, MA 01826
Estimated Value: $523,870 - $639,000
3
Beds
2
Baths
1,728
Sq Ft
$347/Sq Ft
Est. Value
About This Home
This home is located at 28 Kent St, Dracut, MA 01826 and is currently estimated at $598,968, approximately $346 per square foot. 28 Kent St is a home located in Middlesex County with nearby schools including Joseph McAvinnue Elementary School, Charlotte M. Murkland Elementary School, and Charles W. Morey Elementary School.
Ownership History
Date
Name
Owned For
Owner Type
Purchase Details
Closed on
Feb 10, 2017
Sold by
Sheehan Kenneth R and Sheehan Shawna E
Bought by
Sheehan Kenneth R and Sheehan Shirley T
Current Estimated Value
Purchase Details
Closed on
Aug 2, 2006
Sold by
Pekkala Ft
Bought by
Sheehan Kenneth R and Sheehan Shawna E
Home Financials for this Owner
Home Financials are based on the most recent Mortgage that was taken out on this home.
Original Mortgage
$290,000
Interest Rate
6.7%
Mortgage Type
Purchase Money Mortgage
Purchase Details
Closed on
Mar 21, 2006
Sold by
Pekkala Kathleen and Pekkala Mark D
Bought by
Pekkala Ft
Purchase Details
Closed on
Jun 7, 2004
Sold by
Whiting Ronald W and Whiting Barbara
Bought by
Pekkala Mark K and Pekkala Kathleen
Home Financials for this Owner
Home Financials are based on the most recent Mortgage that was taken out on this home.
Original Mortgage
$292,500
Interest Rate
5.94%
Mortgage Type
Purchase Money Mortgage
Create a Home Valuation Report for This Property
The Home Valuation Report is an in-depth analysis detailing your home's value as well as a comparison with similar homes in the area
Home Values in the Area
Average Home Value in this Area
Purchase History
| Date | Buyer | Sale Price | Title Company |
|---|---|---|---|
| Sheehan Kenneth R | -- | -- | |
| Sheehan Kenneth R | $365,000 | -- | |
| Pekkala Ft | -- | -- | |
| Pekkala Mark K | $325,000 | -- |
Source: Public Records
Mortgage History
| Date | Status | Borrower | Loan Amount |
|---|---|---|---|
| Previous Owner | Sheehan Kenneth R | $290,000 | |
| Previous Owner | Pekkala Mark K | $292,500 |
Source: Public Records
Tax History Compared to Growth
Tax History
| Year | Tax Paid | Tax Assessment Tax Assessment Total Assessment is a certain percentage of the fair market value that is determined by local assessors to be the total taxable value of land and additions on the property. | Land | Improvement |
|---|---|---|---|---|
| 2025 | $4,354 | $430,200 | $187,400 | $242,800 |
| 2024 | $4,229 | $404,700 | $178,400 | $226,300 |
| 2023 | $4,403 | $380,200 | $155,100 | $225,100 |
| 2022 | $4,138 | $336,700 | $141,000 | $195,700 |
| 2021 | $9,834 | $302,500 | $128,200 | $174,300 |
| 2020 | $5,309 | $282,300 | $124,500 | $157,800 |
| 2019 | $3,799 | $276,300 | $118,500 | $157,800 |
| 2018 | $3,674 | $259,800 | $118,500 | $141,300 |
| 2017 | $3,406 | $259,800 | $118,500 | $141,300 |
| 2016 | $3,358 | $226,300 | $114,000 | $112,300 |
| 2015 | $3,379 | $226,300 | $114,000 | $112,300 |
| 2014 | $3,307 | $228,200 | $114,000 | $114,200 |
Source: Public Records
Map
Nearby Homes
- 20 Kent St
- 29 Kent St
- 47 Kent St
- 27 Jordan St
- 458 Riverside St
- 33 Jordan St
- 43 Jordan St
- 377 4th Ave
- 51 Jordan St
- 15 Jordan St Unit 2
- 15 Jordan St Unit 1
- 466 Riverside St
- 446 Riverside St Unit 2
- 472 Riverside St
- 13 Jordan St
- 444 Riverside St Unit 1
- 444 Riverside St Unit 2
- 444 Riverside St
- 55 Jordon St
- 30 Jordan St