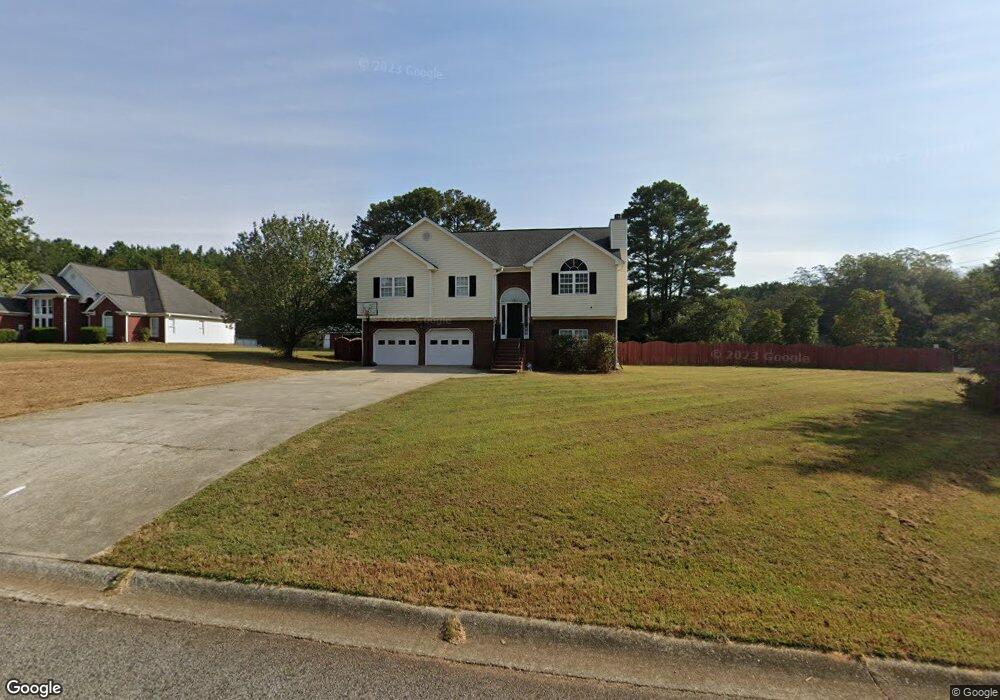
28 Keys Dr Braselton, GA 30517
Estimated Value: $334,991 - $388,000
--
Bed
3
Baths
1,525
Sq Ft
$236/Sq Ft
Est. Value
About This Home
This home is located at 28 Keys Dr, Braselton, GA 30517 and is currently estimated at $360,248, approximately $236 per square foot. 28 Keys Dr is a home located in Jackson County with nearby schools including West Jackson Elementary School, West Jackson Middle School, and Jackson County High School.
Ownership History
Date
Name
Owned For
Owner Type
Purchase Details
Closed on
Jun 4, 2014
Sold by
Interholzinger Heather L
Bought by
Interholzinger Frank R
Current Estimated Value
Purchase Details
Closed on
Sep 30, 2005
Sold by
Bryant Samuel K
Bought by
Interholzinger Frank R and Interholzinger Heather L
Home Financials for this Owner
Home Financials are based on the most recent Mortgage that was taken out on this home.
Original Mortgage
$149,264
Interest Rate
5.66%
Mortgage Type
FHA
Purchase Details
Closed on
Dec 7, 2001
Sold by
Butler Wendell
Bought by
Bryant Samuel K
Purchase Details
Closed on
Apr 10, 2000
Sold by
Bryant Debra B
Bought by
Butler Wendell
Purchase Details
Closed on
Dec 9, 1998
Sold by
Bryant Debra B
Bought by
Bryant Debra B
Purchase Details
Closed on
Nov 30, 1998
Sold by
Gadell Inc
Bought by
Bryant Debra B
Purchase Details
Closed on
Mar 18, 1998
Sold by
Barcron Inc
Bought by
Gadell Inc
Create a Home Valuation Report for This Property
The Home Valuation Report is an in-depth analysis detailing your home's value as well as a comparison with similar homes in the area
Home Values in the Area
Average Home Value in this Area
Purchase History
| Date | Buyer | Sale Price | Title Company |
|---|---|---|---|
| Interholzinger Frank R | -- | -- | |
| Interholzinger Frank R | $150,500 | -- | |
| Bryant Samuel K | $142,000 | -- | |
| Butler Wendell | $120,000 | -- | |
| Bryant Debra B | -- | -- | |
| Bryant Debra B | $122,900 | -- | |
| Gadell Inc | $89,500 | -- |
Source: Public Records
Mortgage History
| Date | Status | Borrower | Loan Amount |
|---|---|---|---|
| Previous Owner | Interholzinger Frank R | $149,264 |
Source: Public Records
Tax History Compared to Growth
Tax History
| Year | Tax Paid | Tax Assessment Tax Assessment Total Assessment is a certain percentage of the fair market value that is determined by local assessors to be the total taxable value of land and additions on the property. | Land | Improvement |
|---|---|---|---|---|
| 2024 | $2,968 | $106,560 | $17,600 | $88,960 |
| 2023 | $2,968 | $94,880 | $17,600 | $77,280 |
| 2022 | $2,432 | $77,720 | $17,600 | $60,120 |
| 2021 | $2,143 | $68,120 | $8,000 | $60,120 |
| 2020 | $1,948 | $57,240 | $8,000 | $49,240 |
| 2019 | $1,983 | $57,240 | $8,000 | $49,240 |
| 2018 | $1,915 | $54,880 | $8,000 | $46,880 |
| 2017 | $1,828 | $52,086 | $8,000 | $44,086 |
| 2016 | $1,836 | $52,086 | $8,000 | $44,086 |
| 2015 | $1,843 | $52,086 | $8,000 | $44,086 |
| 2014 | $1,585 | $45,889 | $8,000 | $37,889 |
| 2013 | -- | $45,889 | $8,000 | $37,889 |
Source: Public Records
Map
Nearby Homes
- 225 Hickory Grove Ln
- 39 Pecan Ct
- 222 Hickory Grove Ln
- 411 Red Wood Ln
- Charlton Plan at Maddox Landing
- Emerson Plan at Maddox Landing
- Baldwin Plan at Maddox Landing
- Atkinson Plan at Maddox Landing
- Warren Plan at Maddox Landing
- Madison Plan at Maddox Landing
- Canton Plan at Maddox Landing
- Glynn Plan at Maddox Landing
- 408 Red Wood Ln
- 370 Red Wood Ln
- 125 Osprey Overlook Dr
- 264 Golden Eagle Pkwy
- 0 Lewis Braselton Blvd Unit 10646660
- 73 Osprey Overlook Dr