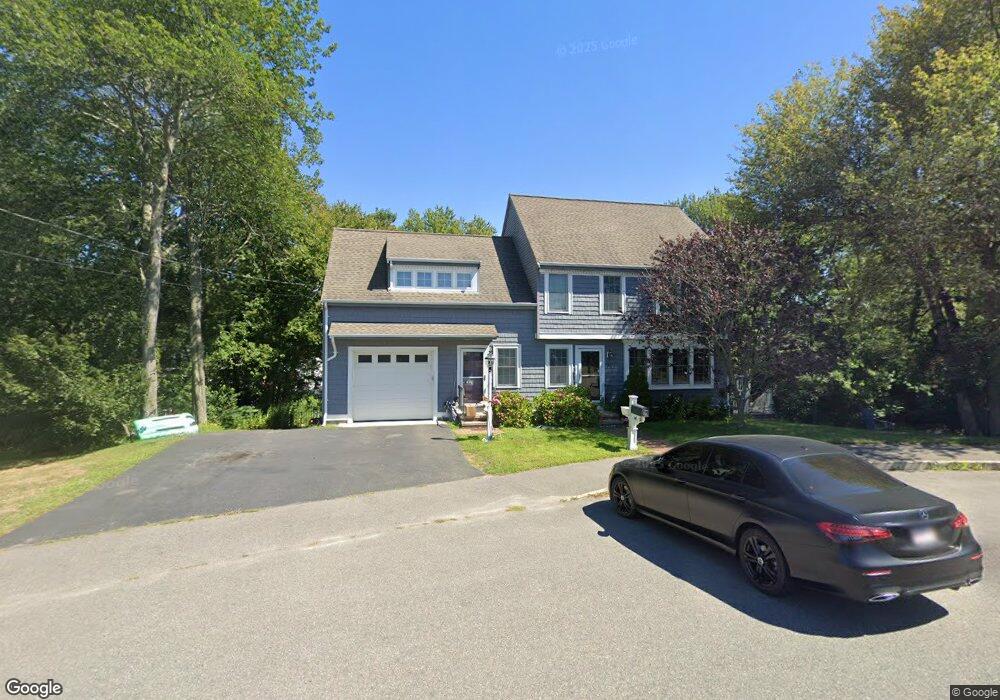
28 Kipling Rd South Weymouth, MA 02190
South Weymouth NeighborhoodEstimated Value: $738,000 - $902,000
3
Beds
2
Baths
1,300
Sq Ft
$642/Sq Ft
Est. Value
About This Home
This home is located at 28 Kipling Rd, South Weymouth, MA 02190 and is currently estimated at $834,092, approximately $641 per square foot. 28 Kipling Rd is a home located in Norfolk County with nearby schools including Ralph Talbot Primary School, Abigail Adams Middle School, and Weymouth Middle School Chapman.
Ownership History
Date
Name
Owned For
Owner Type
Purchase Details
Closed on
Apr 25, 2003
Sold by
Ierardi Evelyn H
Bought by
Dimodica Joseph and Dimodica Nancy
Current Estimated Value
Home Financials for this Owner
Home Financials are based on the most recent Mortgage that was taken out on this home.
Original Mortgage
$314,900
Outstanding Balance
$134,186
Interest Rate
5.64%
Mortgage Type
Purchase Money Mortgage
Estimated Equity
$699,906
Create a Home Valuation Report for This Property
The Home Valuation Report is an in-depth analysis detailing your home's value as well as a comparison with similar homes in the area
Home Values in the Area
Average Home Value in this Area
Purchase History
| Date | Buyer | Sale Price | Title Company |
|---|---|---|---|
| Dimodica Joseph | $349,900 | -- |
Source: Public Records
Mortgage History
| Date | Status | Borrower | Loan Amount |
|---|---|---|---|
| Open | Dimodica Joseph | $314,900 |
Source: Public Records
Tax History Compared to Growth
Tax History
| Year | Tax Paid | Tax Assessment Tax Assessment Total Assessment is a certain percentage of the fair market value that is determined by local assessors to be the total taxable value of land and additions on the property. | Land | Improvement |
|---|---|---|---|---|
| 2025 | $8,680 | $859,400 | $242,000 | $617,400 |
| 2024 | $8,472 | $824,900 | $230,500 | $594,400 |
| 2023 | $8,010 | $766,500 | $232,800 | $533,700 |
| 2022 | $7,819 | $682,300 | $215,600 | $466,700 |
| 2021 | $7,293 | $621,200 | $215,600 | $405,600 |
| 2020 | $6,984 | $585,900 | $215,600 | $370,300 |
| 2019 | $6,860 | $566,000 | $207,300 | $358,700 |
| 2018 | $6,675 | $534,000 | $197,400 | $336,600 |
| 2017 | $6,565 | $512,500 | $188,000 | $324,500 |
| 2016 | $6,353 | $496,300 | $180,800 | $315,500 |
| 2015 | $6,086 | $471,800 | $180,800 | $291,000 |
| 2014 | $5,839 | $439,000 | $168,300 | $270,700 |
Source: Public Records
Map
Nearby Homes
- 279 Pine St
- 341 Ralph Talbot St
- 675 Pleasant St Unit 8
- 376 Pleasant St
- 110 Burkhall St Unit H
- 191 Tall Oaks Dr Unit C
- 120 Burkhall St Unit K
- 200 Burkhall St Unit 102
- 261 Pleasant St Unit 3
- 261 Pleasant St Unit 5
- 79 Tilden Rd
- 131 Mutton Ln
- 15 Ranger Cir
- 14 Old Stone Way Unit 11
- 1015 Washington St
- 955 Pleasant St Unit 11
- 10 Chapman St Unit 202
- 18 Whiting Ln
- 966 Washington St Unit 2
- 25 Echo Ave