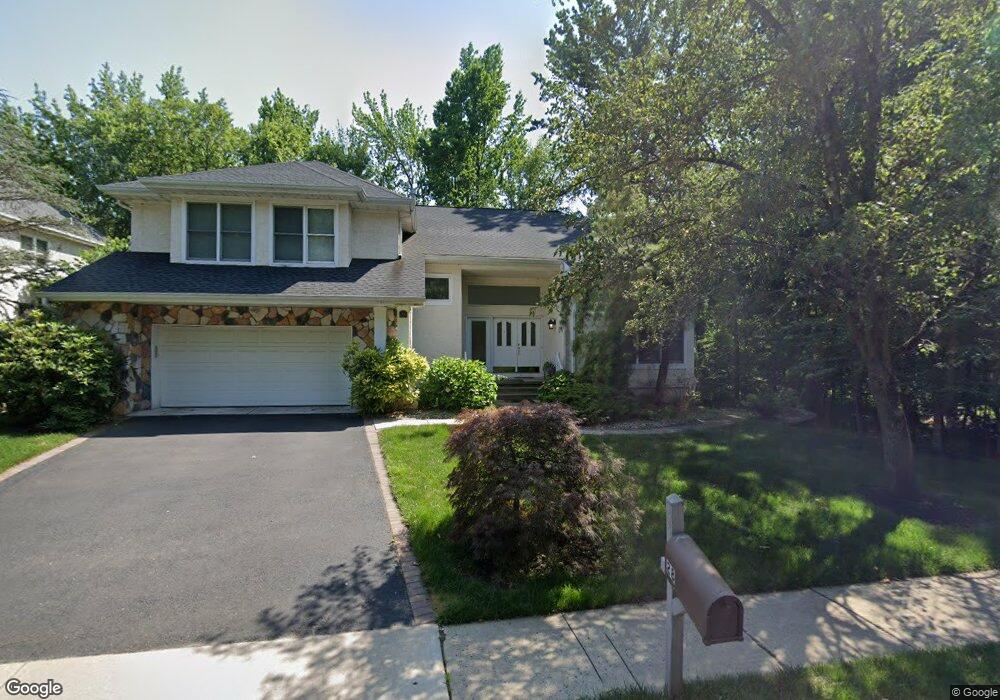
28 Lavender Dr Princeton, NJ 08540
Estimated Value: $903,000 - $1,096,000
3
Beds
5
Baths
3,313
Sq Ft
$314/Sq Ft
Est. Value
About This Home
This home is located at 28 Lavender Dr, Princeton, NJ 08540 and is currently estimated at $1,040,405, approximately $314 per square foot. 28 Lavender Dr is a home located in Middlesex County with nearby schools including Cambridge Elementary School, Crossroads South Middle School, and South Brunswick High School.
Ownership History
Date
Name
Owned For
Owner Type
Purchase Details
Closed on
Jul 2, 2008
Sold by
Shipp Michael and Shipp Michele C
Bought by
Nithyanandam Srinivas and Srinivas Sridevi
Current Estimated Value
Home Financials for this Owner
Home Financials are based on the most recent Mortgage that was taken out on this home.
Original Mortgage
$417,000
Outstanding Balance
$269,836
Interest Rate
6.13%
Mortgage Type
Purchase Money Mortgage
Estimated Equity
$770,569
Purchase Details
Closed on
Jul 30, 2000
Sold by
Shum Kit
Bought by
Shipp Michael and Shipp Michele
Home Financials for this Owner
Home Financials are based on the most recent Mortgage that was taken out on this home.
Original Mortgage
$224,400
Interest Rate
8.13%
Purchase Details
Closed on
Jul 17, 1995
Sold by
Eastern Homes L P
Bought by
Shum Kit
Home Financials for this Owner
Home Financials are based on the most recent Mortgage that was taken out on this home.
Original Mortgage
$260,000
Interest Rate
7.49%
Create a Home Valuation Report for This Property
The Home Valuation Report is an in-depth analysis detailing your home's value as well as a comparison with similar homes in the area
Home Values in the Area
Average Home Value in this Area
Purchase History
| Date | Buyer | Sale Price | Title Company |
|---|---|---|---|
| Nithyanandam Srinivas | $689,000 | First American Title Ins Co | |
| Shipp Michael | $418,000 | -- | |
| Shum Kit | $354,900 | -- |
Source: Public Records
Mortgage History
| Date | Status | Borrower | Loan Amount |
|---|---|---|---|
| Open | Nithyanandam Srinivas | $417,000 | |
| Previous Owner | Shipp Michael | $224,400 | |
| Previous Owner | Shum Kit | $260,000 |
Source: Public Records
Tax History Compared to Growth
Tax History
| Year | Tax Paid | Tax Assessment Tax Assessment Total Assessment is a certain percentage of the fair market value that is determined by local assessors to be the total taxable value of land and additions on the property. | Land | Improvement |
|---|---|---|---|---|
| 2025 | $15,946 | $291,100 | $90,000 | $201,100 |
| 2024 | $15,344 | $291,100 | $90,000 | $201,100 |
| 2023 | $15,344 | $291,100 | $90,000 | $201,100 |
| 2022 | $14,884 | $291,100 | $90,000 | $201,100 |
| 2021 | $11,442 | $291,100 | $90,000 | $201,100 |
| 2020 | $14,960 | $291,100 | $90,000 | $201,100 |
| 2019 | $15,091 | $291,100 | $90,000 | $201,100 |
| 2018 | $14,578 | $291,100 | $90,000 | $201,100 |
| 2017 | $14,555 | $291,100 | $90,000 | $201,100 |
| 2016 | $14,375 | $291,100 | $90,000 | $201,100 |
| 2015 | $13,880 | $291,100 | $90,000 | $201,100 |
| 2014 | $13,658 | $291,100 | $90,000 | $201,100 |
Source: Public Records
Map
Nearby Homes