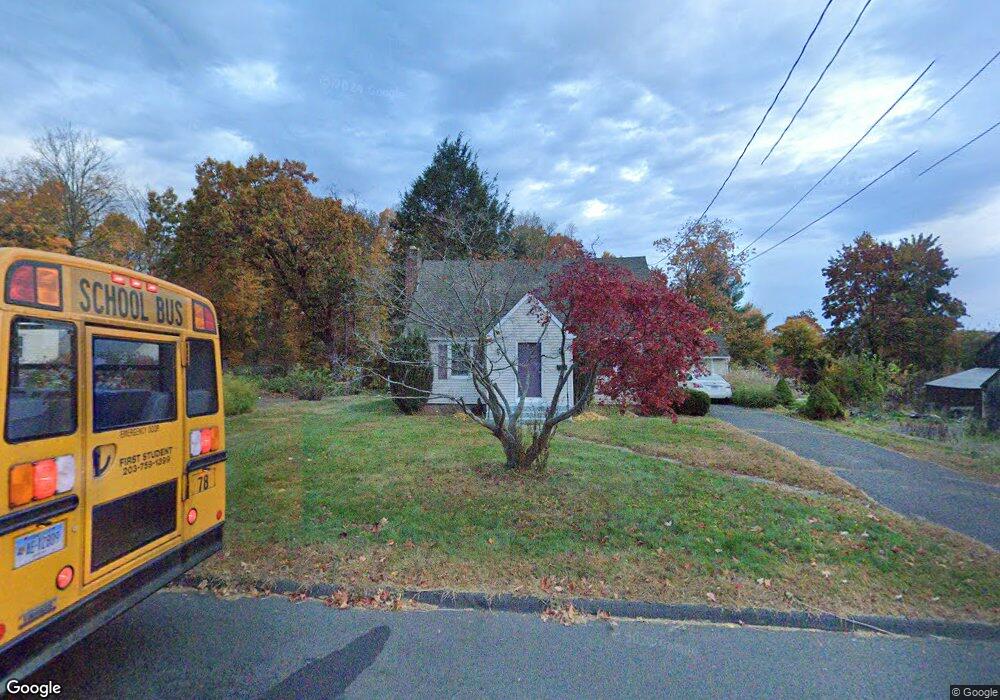
28 Lawndale Ave Bristol, CT 06010
South Bristol NeighborhoodEstimated Value: $276,000 - $326,000
3
Beds
2
Baths
1,386
Sq Ft
$221/Sq Ft
Est. Value
About This Home
This home is located at 28 Lawndale Ave, Bristol, CT 06010 and is currently estimated at $306,661, approximately $221 per square foot. 28 Lawndale Ave is a home located in Hartford County with nearby schools including Chippens Hill Middle School, Bristol Central High School, and Immanuel Lutheran School.
Ownership History
Date
Name
Owned For
Owner Type
Purchase Details
Closed on
Jun 22, 2015
Sold by
Lavenski Tina M
Bought by
Lavenski David P
Current Estimated Value
Purchase Details
Closed on
Dec 23, 2011
Sold by
Nutmeg Homes Llc
Bought by
Lavenski Tina and Lavenski David
Purchase Details
Closed on
May 4, 2011
Sold by
Denote Frederic
Bought by
Nutmeg Homes Llc
Purchase Details
Closed on
Apr 4, 2011
Sold by
Us Bank Na
Bought by
Fhlmc
Purchase Details
Closed on
Feb 16, 2011
Sold by
Davilio Mark J
Bought by
Us Bk
Purchase Details
Closed on
Jun 16, 2000
Sold by
Pelletier Scott J and Pelletier Nancy B
Bought by
Davilio Mark J
Purchase Details
Closed on
Aug 26, 1997
Sold by
Michaud Adrain
Bought by
Scotts Carpentry Llc
Purchase Details
Closed on
Dec 24, 1996
Sold by
Tocionis Robert W
Bought by
Pelletier Scott J and Pelletier Nancy B
Create a Home Valuation Report for This Property
The Home Valuation Report is an in-depth analysis detailing your home's value as well as a comparison with similar homes in the area
Home Values in the Area
Average Home Value in this Area
Purchase History
| Date | Buyer | Sale Price | Title Company |
|---|---|---|---|
| Lavenski David P | -- | -- | |
| Lavenski Tina | $162,500 | -- | |
| Nutmeg Homes Llc | -- | -- | |
| Denote Frederic | -- | -- | |
| Fhlmc | -- | -- | |
| Us Bk | -- | -- | |
| Davilio Mark J | $122,000 | -- | |
| Scotts Carpentry Llc | $80,000 | -- | |
| Pelletier Scott J | $95,000 | -- |
Source: Public Records
Mortgage History
| Date | Status | Borrower | Loan Amount |
|---|---|---|---|
| Open | Pelletier Scott J | $43,543 |
Source: Public Records
Tax History Compared to Growth
Tax History
| Year | Tax Paid | Tax Assessment Tax Assessment Total Assessment is a certain percentage of the fair market value that is determined by local assessors to be the total taxable value of land and additions on the property. | Land | Improvement |
|---|---|---|---|---|
| 2025 | $4,940 | $146,370 | $35,770 | $110,600 |
| 2024 | $4,662 | $146,370 | $35,770 | $110,600 |
| 2023 | $4,442 | $146,370 | $35,770 | $110,600 |
| 2022 | $3,986 | $103,950 | $27,090 | $76,860 |
| 2021 | $3,986 | $103,950 | $27,090 | $76,860 |
| 2020 | $3,986 | $103,950 | $27,090 | $76,860 |
| 2019 | $3,955 | $103,950 | $27,090 | $76,860 |
| 2018 | $3,834 | $103,950 | $27,090 | $76,860 |
| 2017 | $3,942 | $109,410 | $38,710 | $70,700 |
| 2016 | $3,942 | $109,410 | $38,710 | $70,700 |
| 2015 | $3,787 | $109,410 | $38,710 | $70,700 |
| 2014 | $3,787 | $109,410 | $38,710 | $70,700 |
Source: Public Records
Map
Nearby Homes
- 38 Lawndale Ave
- 27 Lawndale Ave Unit 2
- 25 Lawndale Ave Unit 2
- 25 Lawndale Ave
- 19 Lawndale Ave Unit 2
- 19 Lawndale Ave Unit 1
- 19 Lawndale Ave
- 35 Lawndale Ave
- 45 Lawndale Ave
- 44 Lawndale Ave
- 73 Lawndale Ave
- 49 Lawndale Ave
- 64 Wolcott St
- 86 Wolcott St
- 86 Wolcott St Unit Floor 2
- 86 Wolcott St Unit Floor 1
- 52 Lawndale Ave
- 30 Atkins Ave
- 24 Atkins Ave
- 38 Atkins Ave