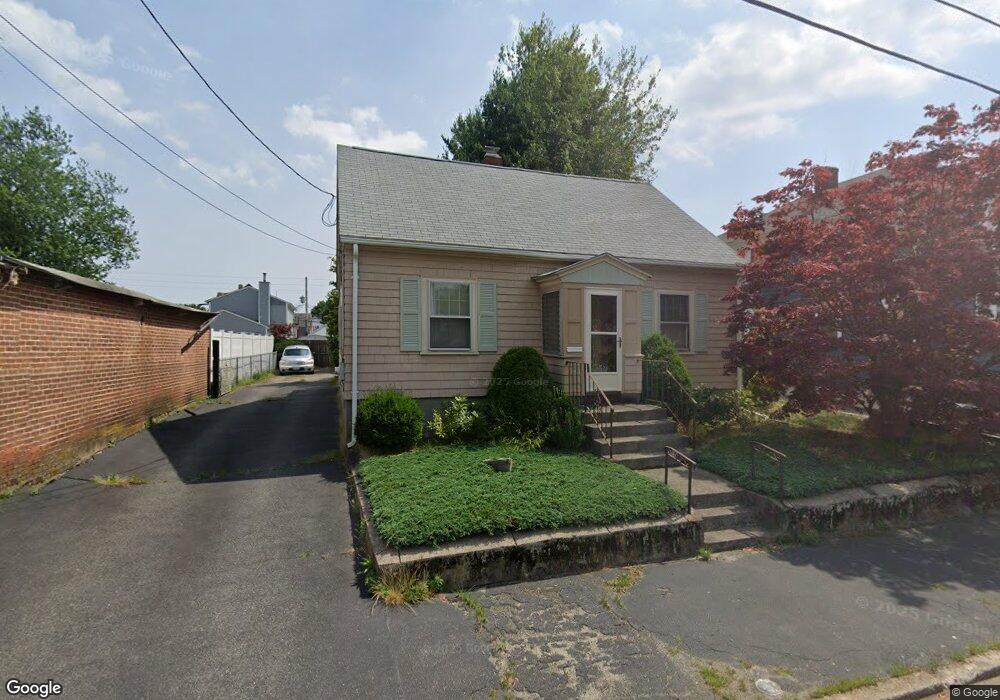
28 Lucas St Pawtucket, RI 02860
Saylesville Highlands NeighborhoodEstimated Value: $377,000 - $407,000
3
Beds
3
Baths
1,248
Sq Ft
$312/Sq Ft
Est. Value
About This Home
This home is located at 28 Lucas St, Pawtucket, RI 02860 and is currently estimated at $389,819, approximately $312 per square foot. 28 Lucas St is a home located in Providence County with nearby schools including Blackstone Valley Prep Upper Elementary School, Blackstone Valley Prep Junior High School, and Bishop Keough Regional High School.
Ownership History
Date
Name
Owned For
Owner Type
Purchase Details
Closed on
Dec 22, 1992
Sold by
Gouveia Maria Est
Bought by
Carpenter Charles J and Carpenter David J
Current Estimated Value
Home Financials for this Owner
Home Financials are based on the most recent Mortgage that was taken out on this home.
Original Mortgage
$76,000
Interest Rate
8.3%
Create a Home Valuation Report for This Property
The Home Valuation Report is an in-depth analysis detailing your home's value as well as a comparison with similar homes in the area
Home Values in the Area
Average Home Value in this Area
Purchase History
| Date | Buyer | Sale Price | Title Company |
|---|---|---|---|
| Carpenter Charles J | $80,000 | -- |
Source: Public Records
Mortgage History
| Date | Status | Borrower | Loan Amount |
|---|---|---|---|
| Open | Carpenter Charles J | $65,000 | |
| Closed | Carpenter Charles J | $76,000 |
Source: Public Records
Tax History
| Year | Tax Paid | Tax Assessment Tax Assessment Total Assessment is a certain percentage of the fair market value that is determined by local assessors to be the total taxable value of land and additions on the property. | Land | Improvement |
|---|---|---|---|---|
| 2025 | $3,540 | $269,200 | $127,400 | $141,800 |
| 2024 | $3,322 | $269,200 | $127,400 | $141,800 |
| 2023 | $3,510 | $207,200 | $69,400 | $137,800 |
| 2022 | $3,435 | $207,200 | $69,400 | $137,800 |
| 2021 | $3,435 | $207,200 | $69,400 | $137,800 |
| 2020 | $3,459 | $165,600 | $64,000 | $101,600 |
| 2019 | $3,459 | $165,600 | $64,000 | $101,600 |
| 2018 | $3,334 | $165,600 | $64,000 | $101,600 |
| 2017 | $3,281 | $144,400 | $58,500 | $85,900 |
| 2016 | $3,161 | $144,400 | $58,500 | $85,900 |
| 2015 | $3,161 | $144,400 | $58,500 | $85,900 |
| 2014 | $3,231 | $140,100 | $58,500 | $81,600 |
Source: Public Records
Map
Nearby Homes
Your Personal Tour Guide
Ask me questions while you tour the home.