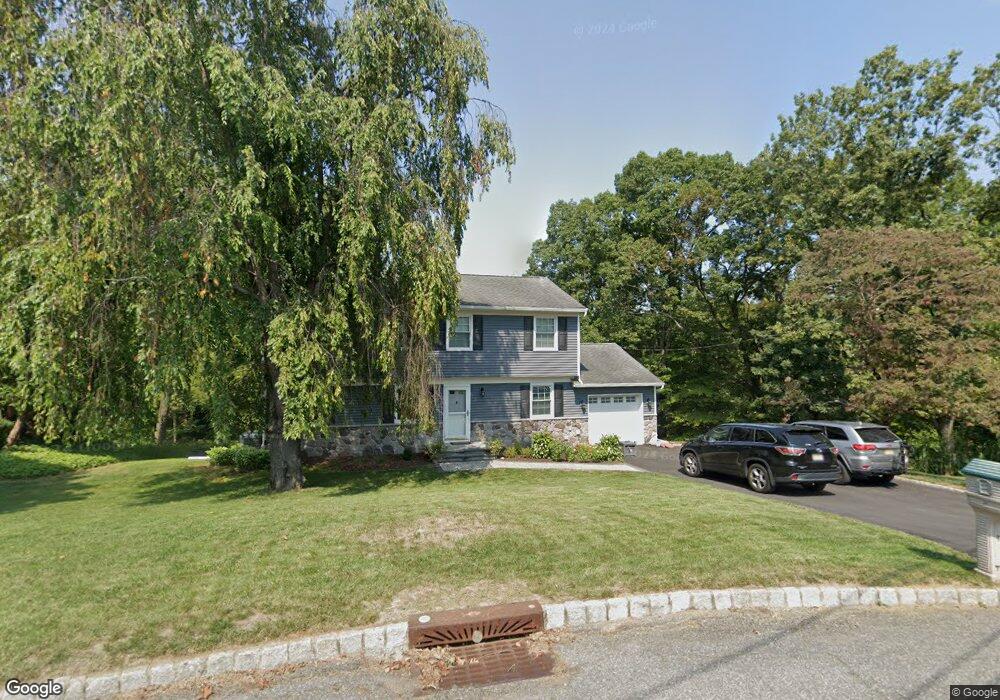
28 Mac Arthur St High Bridge, NJ 08829
Estimated Value: $547,627 - $601,000
--
Bed
--
Bath
1,862
Sq Ft
$308/Sq Ft
Est. Value
About This Home
This home is located at 28 Mac Arthur St, High Bridge, NJ 08829 and is currently estimated at $572,907, approximately $307 per square foot. 28 Mac Arthur St is a home located in Hunterdon County with nearby schools including High Bridge Elementary School, High Bridge Middle School, and Voorhees High School.
Ownership History
Date
Name
Owned For
Owner Type
Purchase Details
Closed on
Jan 19, 2010
Sold by
Berman Yannick and Berman Christine
Bought by
Berman Yannick and Berman Christine
Current Estimated Value
Home Financials for this Owner
Home Financials are based on the most recent Mortgage that was taken out on this home.
Original Mortgage
$185,000
Interest Rate
4.39%
Mortgage Type
New Conventional
Purchase Details
Closed on
Aug 23, 2000
Sold by
Fani Joseph
Bought by
Berman Yannick and St Pierre Christine
Home Financials for this Owner
Home Financials are based on the most recent Mortgage that was taken out on this home.
Original Mortgage
$230,000
Interest Rate
8.1%
Purchase Details
Closed on
Jun 21, 1993
Sold by
Hufford Richard E and Hufford Susan L
Bought by
Fani Joseph and Fani Pamela L
Purchase Details
Closed on
Apr 7, 1991
Sold by
Deeble Ronald E and Deeble Lindsay M
Bought by
Hufford Richard E and Hufford Susan L
Create a Home Valuation Report for This Property
The Home Valuation Report is an in-depth analysis detailing your home's value as well as a comparison with similar homes in the area
Home Values in the Area
Average Home Value in this Area
Purchase History
| Date | Buyer | Sale Price | Title Company |
|---|---|---|---|
| Berman Yannick | -- | Lsi Lps | |
| Berman Yannick | $288,000 | -- | |
| Berman Yannick | $288,000 | -- | |
| Fani Joseph | $177,000 | -- | |
| Hufford Richard E | $157,000 | -- |
Source: Public Records
Mortgage History
| Date | Status | Borrower | Loan Amount |
|---|---|---|---|
| Closed | Berman Yannick | $185,000 | |
| Closed | Berman Yannick | $230,000 |
Source: Public Records
Tax History Compared to Growth
Tax History
| Year | Tax Paid | Tax Assessment Tax Assessment Total Assessment is a certain percentage of the fair market value that is determined by local assessors to be the total taxable value of land and additions on the property. | Land | Improvement |
|---|---|---|---|---|
| 2025 | $13,125 | $443,800 | $219,900 | $223,900 |
| 2024 | $12,854 | $402,100 | $159,600 | $242,500 |
| 2023 | $12,854 | $325,100 | $155,900 | $169,200 |
| 2022 | $13,148 | $309,000 | $138,800 | $170,200 |
| 2021 | $12,843 | $309,400 | $138,800 | $170,600 |
| 2020 | $12,706 | $309,900 | $138,400 | $171,500 |
| 2019 | $12,843 | $310,900 | $138,400 | $172,500 |
| 2018 | $12,337 | $311,300 | $137,800 | $173,500 |
| 2017 | $11,346 | $294,400 | $117,800 | $176,600 |
| 2016 | $11,214 | $294,400 | $117,800 | $176,600 |
| 2015 | $10,910 | $294,400 | $117,800 | $176,600 |
| 2014 | $12,581 | $366,900 | $150,700 | $216,200 |
Source: Public Records
Map
Nearby Homes
- 72 E Main St
- 21 E Main St
- 8 Maryland Ave
- 33 John Dr
- 3 Chestnut Ct
- 6 John Dr
- 143 Annandale High Bridge Rd
- 10 Timbercroft Rd
- 128 Annandale High Bridge Rd
- 3 Grace Dr
- 7 Hoffman Rd
- 77 Main St
- 5 Deer Run Dr
- 44 Beavers St
- 0 Beavers St
- 48 Jericho Rd
- 19 Hillcrest Ln
- 79 Fairview Ave
- 1 Rossi Dr
- 10 Belvidere Ave