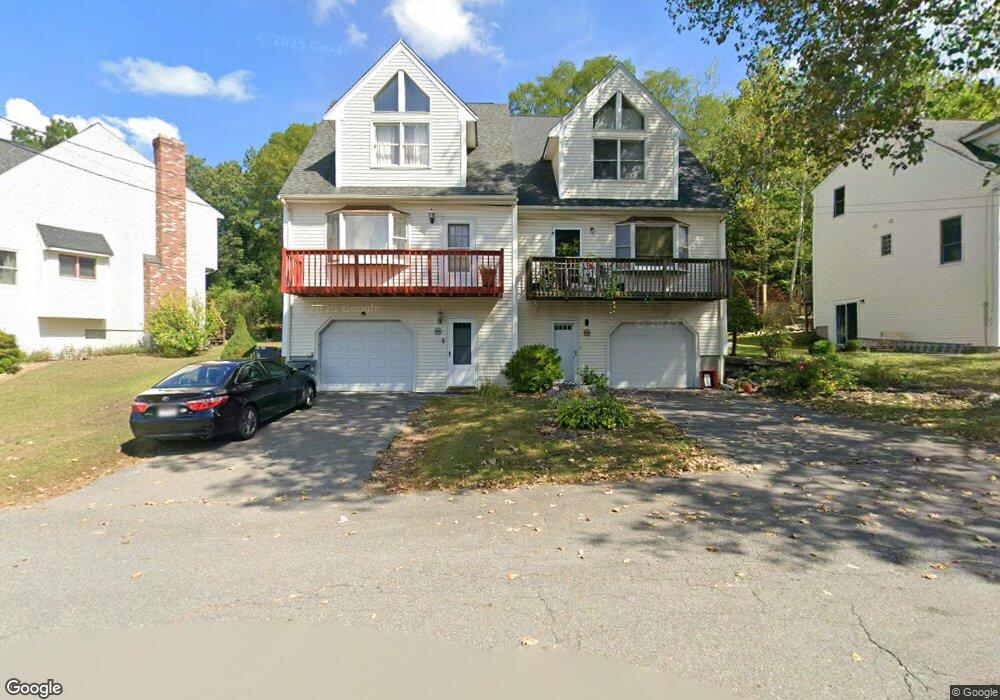
28 Mahogany Run Leominster, MA 01453
Estimated Value: $357,591 - $379,000
2
Beds
2
Baths
1,168
Sq Ft
$315/Sq Ft
Est. Value
About This Home
This home is located at 28 Mahogany Run, Leominster, MA 01453 and is currently estimated at $368,148, approximately $315 per square foot. 28 Mahogany Run is a home located in Worcester County with nearby schools including Leominster High School, St. Anna Catholic School, and St. Leo School.
Ownership History
Date
Name
Owned For
Owner Type
Purchase Details
Closed on
May 10, 2018
Sold by
Banks Steven E
Bought by
Banks Ret
Current Estimated Value
Purchase Details
Closed on
Jul 10, 2008
Sold by
Bjork Helena M and Prentiss Helena M
Bought by
Banks Steven E
Home Financials for this Owner
Home Financials are based on the most recent Mortgage that was taken out on this home.
Original Mortgage
$137,000
Interest Rate
6.13%
Mortgage Type
Purchase Money Mortgage
Purchase Details
Closed on
Aug 26, 1998
Sold by
Potter Joseph O and Kline Richard Alan
Bought by
Bjork William S and Bjork Helena M
Home Financials for this Owner
Home Financials are based on the most recent Mortgage that was taken out on this home.
Original Mortgage
$50,400
Interest Rate
6.9%
Mortgage Type
Purchase Money Mortgage
Purchase Details
Closed on
Apr 26, 1991
Sold by
Batchelder Peter C
Bought by
Potter Joseph L and Richard Alan Kines
Home Financials for this Owner
Home Financials are based on the most recent Mortgage that was taken out on this home.
Original Mortgage
$83,850
Interest Rate
9.41%
Mortgage Type
Purchase Money Mortgage
Create a Home Valuation Report for This Property
The Home Valuation Report is an in-depth analysis detailing your home's value as well as a comparison with similar homes in the area
Home Values in the Area
Average Home Value in this Area
Purchase History
| Date | Buyer | Sale Price | Title Company |
|---|---|---|---|
| Banks Ret | -- | -- | |
| Banks Steven E | $162,000 | -- | |
| Bjork William S | $84,000 | -- | |
| Potter Joseph L | $95,000 | -- |
Source: Public Records
Mortgage History
| Date | Status | Borrower | Loan Amount |
|---|---|---|---|
| Previous Owner | Banks Steven E | $137,000 | |
| Previous Owner | Potter Joseph L | $35,000 | |
| Previous Owner | Potter Joseph L | $50,400 | |
| Previous Owner | Potter Joseph L | $83,850 |
Source: Public Records
Tax History Compared to Growth
Tax History
| Year | Tax Paid | Tax Assessment Tax Assessment Total Assessment is a certain percentage of the fair market value that is determined by local assessors to be the total taxable value of land and additions on the property. | Land | Improvement |
|---|---|---|---|---|
| 2025 | $4,418 | $314,900 | $0 | $314,900 |
| 2024 | $3,797 | $261,700 | $0 | $261,700 |
| 2023 | $3,610 | $232,300 | $0 | $232,300 |
| 2022 | $3,131 | $189,100 | $0 | $189,100 |
| 2021 | $2,923 | $161,200 | $0 | $161,200 |
| 2020 | $2,719 | $151,200 | $0 | $151,200 |
| 2019 | $2,583 | $139,300 | $0 | $139,300 |
| 2018 | $2,776 | $143,600 | $0 | $143,600 |
| 2017 | $2,076 | $105,200 | $0 | $105,200 |
| 2016 | $2,064 | $105,400 | $0 | $105,400 |
| 2015 | $2,782 | $143,100 | $0 | $143,100 |
| 2014 | $2,711 | $143,500 | $0 | $143,500 |
Source: Public Records
Map
Nearby Homes
- 58 Mahogany Run
- 56 Mahogany Run
- 52 Mahogany Run
- 48 Mahogany Run
- 44 Mahogany Run
- 35 Mahogany Run
- 33 Mahogany Run
- 32 Balsam Dr
- 30 Mahogany Run
- 28 Balsam Dr
- 26 Balsam Dr
- 24 Mahogany Run
- 23 Balsam Dr
- 22 Mahogany Run
- 18 Mahogany Run
- 17 Mahogany Run
- 15 Balsam Dr
- 14 Mahogany Run
- 13 Mahogany Run
- 12 Mahogany Run