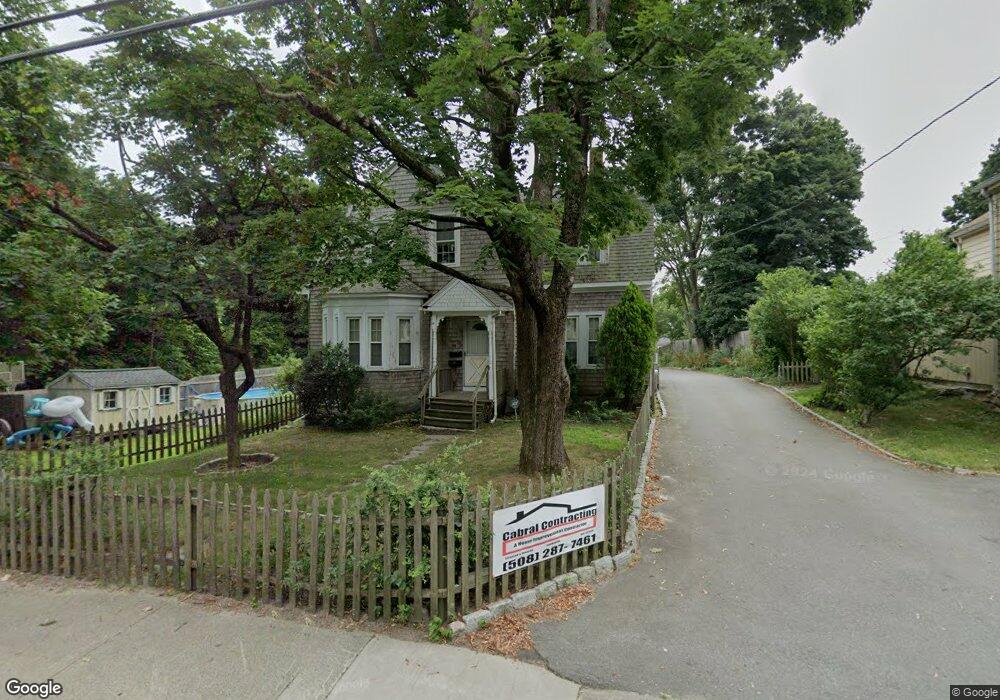
28 Main St Acushnet, MA 02743
Estimated Value: $466,000 - $601,104
5
Beds
3
Baths
2,764
Sq Ft
$198/Sq Ft
Est. Value
About This Home
This home is located at 28 Main St, Acushnet, MA 02743 and is currently estimated at $546,026, approximately $197 per square foot. 28 Main St is a home located in Bristol County with nearby schools including Acushnet Elementary School, Albert F Ford Middle School, and Alma Del Mar Charter School.
Ownership History
Date
Name
Owned For
Owner Type
Purchase Details
Closed on
Jul 2, 2010
Sold by
Cabral Michael J
Bought by
Cabral Michael J and Cabral Danielle S
Current Estimated Value
Home Financials for this Owner
Home Financials are based on the most recent Mortgage that was taken out on this home.
Original Mortgage
$305,625
Outstanding Balance
$203,396
Interest Rate
4.75%
Mortgage Type
FHA
Estimated Equity
$342,630
Purchase Details
Closed on
Sep 20, 2002
Sold by
Milos Theodore E
Bought by
Cabral Michael J
Create a Home Valuation Report for This Property
The Home Valuation Report is an in-depth analysis detailing your home's value as well as a comparison with similar homes in the area
Home Values in the Area
Average Home Value in this Area
Purchase History
| Date | Buyer | Sale Price | Title Company |
|---|---|---|---|
| Cabral Michael J | -- | -- | |
| Cabral Michael J | $154,900 | -- |
Source: Public Records
Mortgage History
| Date | Status | Borrower | Loan Amount |
|---|---|---|---|
| Open | Cabral Michael J | $305,625 | |
| Previous Owner | Cabral Michael J | $82,000 | |
| Previous Owner | Cabral Michael J | $236,500 |
Source: Public Records
Tax History
| Year | Tax Paid | Tax Assessment Tax Assessment Total Assessment is a certain percentage of the fair market value that is determined by local assessors to be the total taxable value of land and additions on the property. | Land | Improvement |
|---|---|---|---|---|
| 2025 | $58 | $539,900 | $132,900 | $407,000 |
| 2024 | $5,888 | $516,000 | $125,900 | $390,100 |
| 2023 | $4,724 | $393,700 | $114,300 | $279,400 |
| 2022 | $4,816 | $362,900 | $107,300 | $255,600 |
| 2021 | $3,799 | $281,600 | $107,300 | $174,300 |
| 2020 | $3,828 | $274,600 | $100,300 | $174,300 |
| 2019 | $3,609 | $254,500 | $95,600 | $158,900 |
| 2018 | $10,352 | $242,400 | $95,600 | $146,800 |
| 2017 | $3,395 | $235,100 | $95,600 | $139,500 |
| 2016 | $3,217 | $221,400 | $95,600 | $125,800 |
| 2015 | $3,162 | $221,400 | $95,600 | $125,800 |
Source: Public Records
Map
Nearby Homes
- 122 Truro St
- 81 Sylvia St
- 11 Boylston St
- 12 Hayes St Unit 1
- 14 Hayes St Unit 1
- 34 Chicopee St
- 14 Caswell St
- 65 Armsby St
- 15 Ball St
- 1940-1942 Acushnet Ave
- 27 Meadow Ln
- 91 S Main St
- 29 Waldo St
- 12 White St
- 209 Jarry St
- 23 Oliveira Ave
- 1077 Shelburne St
- 0 Hathaway Rd Unit 73469544
- 868 Ashley Blvd
- 279 Adelaide St
Your Personal Tour Guide
Ask me questions while you tour the home.