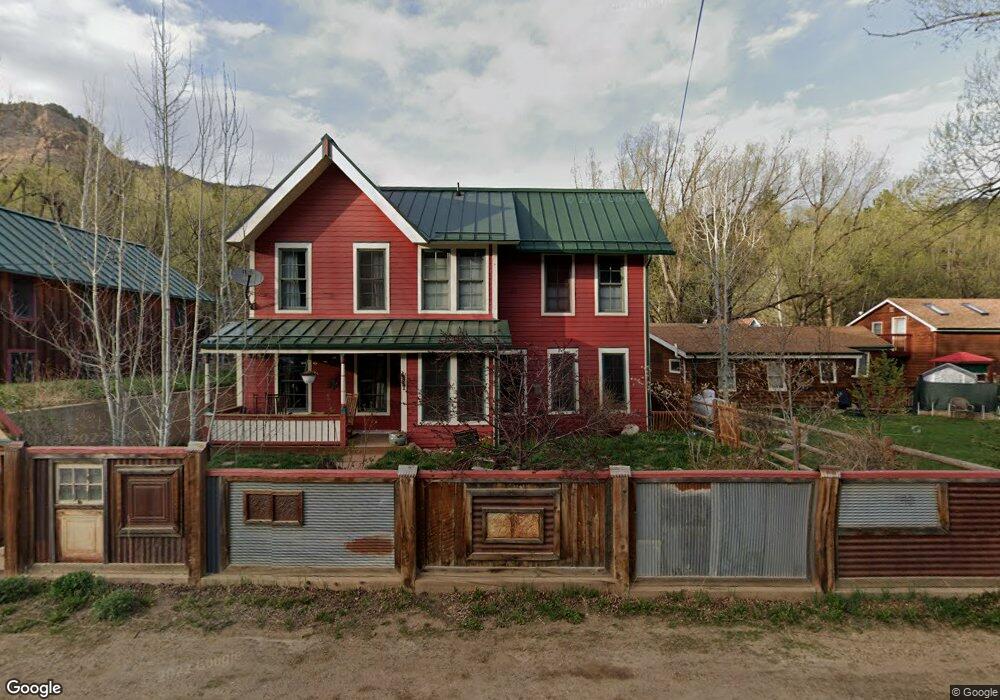
28 Main St Jamestown, CO 80455
Estimated Value: $268,000 - $673,000
3
Beds
2
Baths
1,825
Sq Ft
$309/Sq Ft
Est. Value
About This Home
This home is located at 28 Main St, Jamestown, CO 80455 and is currently estimated at $564,615, approximately $309 per square foot. 28 Main St is a home with nearby schools including Jamestown Elementary School, Centennial Middle School, and Boulder High School.
Ownership History
Date
Name
Owned For
Owner Type
Purchase Details
Closed on
Apr 30, 1997
Sold by
Montag Mark W
Bought by
Obrien Christopher C
Current Estimated Value
Home Financials for this Owner
Home Financials are based on the most recent Mortgage that was taken out on this home.
Original Mortgage
$99,700
Outstanding Balance
$13,561
Interest Rate
7.92%
Mortgage Type
FHA
Estimated Equity
$551,054
Purchase Details
Closed on
May 13, 1994
Sold by
Horlick John A
Bought by
Montag Mark W
Home Financials for this Owner
Home Financials are based on the most recent Mortgage that was taken out on this home.
Original Mortgage
$89,323
Interest Rate
8.03%
Mortgage Type
FHA
Purchase Details
Closed on
Aug 14, 1992
Bought by
Brien Christopher C O and Brien Jennifer K
Purchase Details
Closed on
Jul 1, 1992
Bought by
Brien Christopher C O and Brien Jennifer K
Create a Home Valuation Report for This Property
The Home Valuation Report is an in-depth analysis detailing your home's value as well as a comparison with similar homes in the area
Home Values in the Area
Average Home Value in this Area
Purchase History
| Date | Buyer | Sale Price | Title Company |
|---|---|---|---|
| Obrien Christopher C | $115,000 | -- | |
| Montag Mark W | $89,900 | -- | |
| Brien Christopher C O | -- | -- | |
| Brien Christopher C O | $56,600 | -- |
Source: Public Records
Mortgage History
| Date | Status | Borrower | Loan Amount |
|---|---|---|---|
| Open | Obrien Christopher C | $99,700 | |
| Previous Owner | Montag Mark W | $89,323 |
Source: Public Records
Tax History Compared to Growth
Tax History
| Year | Tax Paid | Tax Assessment Tax Assessment Total Assessment is a certain percentage of the fair market value that is determined by local assessors to be the total taxable value of land and additions on the property. | Land | Improvement |
|---|---|---|---|---|
| 2025 | $4,111 | $37,844 | $2,238 | $35,606 |
| 2024 | $4,111 | $37,844 | $2,238 | $35,606 |
| 2023 | $4,045 | $42,934 | $2,935 | $43,684 |
| 2022 | $3,342 | $33,180 | $2,036 | $31,144 |
| 2021 | $3,315 | $34,136 | $2,095 | $32,041 |
| 2020 | $3,315 | $33,799 | $3,790 | $30,009 |
| 2019 | $3,227 | $33,799 | $3,790 | $30,009 |
| 2018 | $2,591 | $26,805 | $4,248 | $22,557 |
| 2017 | $2,570 | $29,635 | $4,696 | $24,939 |
| 2016 | $2,292 | $20,650 | $3,115 | $17,535 |
| 2015 | $1,937 | $18,945 | $2,858 | $16,087 |
| 2014 | $2,448 | $27,454 | $4,139 | $23,315 |
Source: Public Records
Map
Nearby Homes
- 3819 James Canyon Dr
- 166 High St
- 4 Porphyry View
- 155 Spruce St
- 192 Nugget Hill Rd
- 187 Nugget Hill Rd
- 5567 Lefthand Canyon Dr
- 8493 Lefthand Canyon Dr
- 397 Glendale Gulch Rd
- 323 Roxbury Dr
- 394 Deer Trail Cir
- 124 Deer Trail Cir
- 24 Hickok Trail
- 172 Tall Pine Ln
- 398 Overland Dr
- 173 Silver Cloud Ln
- 84 Ranch Rd
- 133 Mine Ln
- 1689 County Road 83
- 1101 Peakview Cir