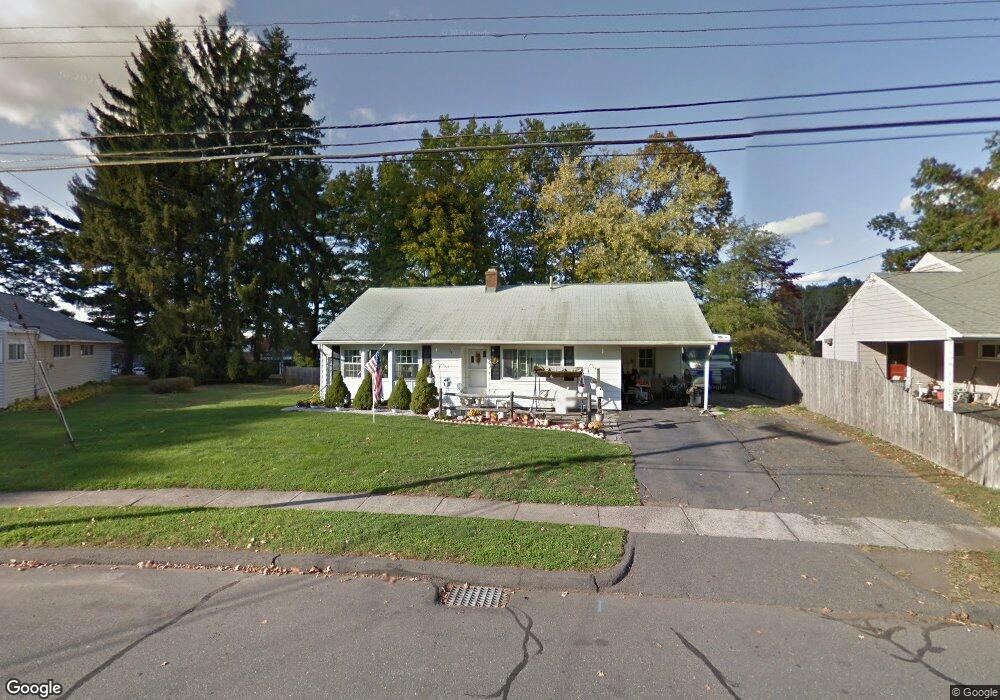
28 Manor Cir East Hartford, CT 06118
Estimated Value: $267,000 - $287,211
2
Beds
1
Bath
1,058
Sq Ft
$262/Sq Ft
Est. Value
About This Home
This home is located at 28 Manor Cir, East Hartford, CT 06118 and is currently estimated at $277,053, approximately $261 per square foot. 28 Manor Cir is a home located in Hartford County with nearby schools including Dr. Thomas S. O'Connell School, East Hartford Middle School, and East Hartford High School.
Ownership History
Date
Name
Owned For
Owner Type
Purchase Details
Closed on
Feb 17, 2017
Sold by
Trigo Steven K and Trigo Joanne L
Bought by
Trigo Steven K
Current Estimated Value
Home Financials for this Owner
Home Financials are based on the most recent Mortgage that was taken out on this home.
Original Mortgage
$83,000
Outstanding Balance
$68,721
Interest Rate
4.2%
Mortgage Type
New Conventional
Estimated Equity
$208,332
Purchase Details
Closed on
Apr 13, 1998
Sold by
Norwest Financial Amer
Bought by
Trigo Steven K
Create a Home Valuation Report for This Property
The Home Valuation Report is an in-depth analysis detailing your home's value as well as a comparison with similar homes in the area
Home Values in the Area
Average Home Value in this Area
Purchase History
| Date | Buyer | Sale Price | Title Company |
|---|---|---|---|
| Trigo Steven K | $64,000 | -- | |
| Trigo Steven K | -- | -- |
Source: Public Records
Mortgage History
| Date | Status | Borrower | Loan Amount |
|---|---|---|---|
| Open | Trigo Steven K | $83,000 | |
| Previous Owner | Trigo Steven K | $37,000 | |
| Previous Owner | Trigo Steven K | $80,000 | |
| Previous Owner | Trigo Steven K | $64,000 |
Source: Public Records
Tax History Compared to Growth
Tax History
| Year | Tax Paid | Tax Assessment Tax Assessment Total Assessment is a certain percentage of the fair market value that is determined by local assessors to be the total taxable value of land and additions on the property. | Land | Improvement |
|---|---|---|---|---|
| 2025 | $5,383 | $117,270 | $43,390 | $73,880 |
| 2024 | $5,160 | $117,270 | $43,390 | $73,880 |
| 2023 | $4,989 | $117,270 | $43,390 | $73,880 |
| 2022 | $4,808 | $117,270 | $43,390 | $73,880 |
| 2021 | $4,276 | $86,650 | $32,870 | $53,780 |
| 2020 | $4,326 | $86,650 | $32,870 | $53,780 |
| 2019 | $4,255 | $86,650 | $32,870 | $53,780 |
| 2018 | $4,130 | $86,650 | $32,870 | $53,780 |
| 2017 | $4,077 | $86,650 | $32,870 | $53,780 |
| 2016 | $3,993 | $87,060 | $32,550 | $54,510 |
| 2015 | $3,993 | $87,060 | $32,550 | $54,510 |
| 2014 | $3,953 | $87,060 | $32,550 | $54,510 |
Source: Public Records
Map
Nearby Homes