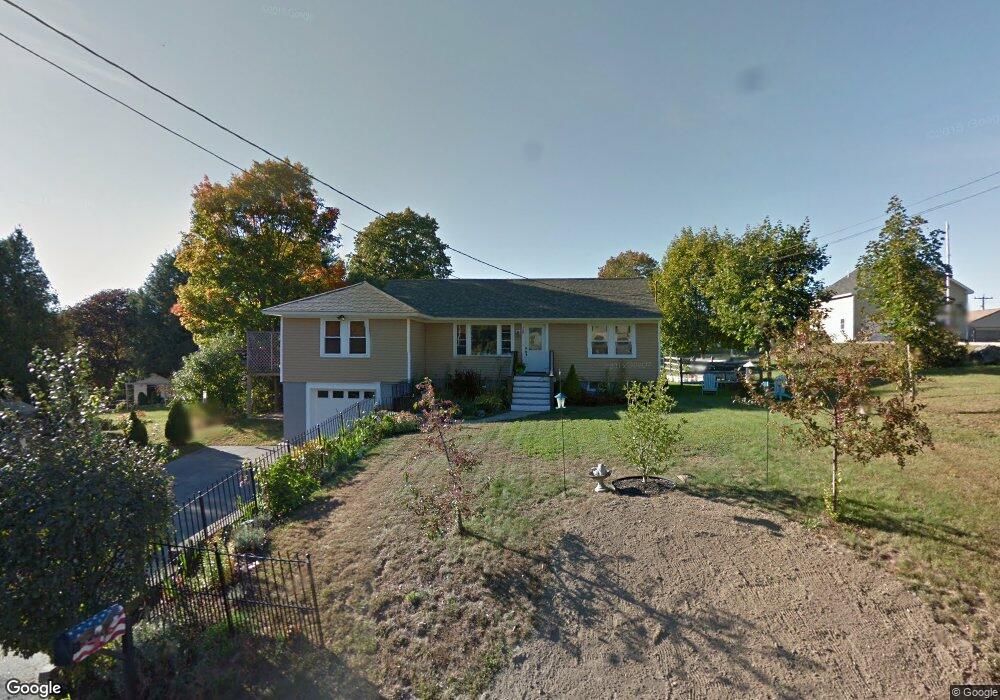
28 Manson Rd Kittery, ME 03904
Estimated Value: $476,000 - $576,000
3
Beds
1
Bath
1,312
Sq Ft
$395/Sq Ft
Est. Value
About This Home
This home is located at 28 Manson Rd, Kittery, ME 03904 and is currently estimated at $518,572, approximately $395 per square foot. 28 Manson Rd is a home located in York County with nearby schools including Shapleigh School, Horace Mitchell Primary School, and Robert W Traip Academy.
Ownership History
Date
Name
Owned For
Owner Type
Purchase Details
Closed on
Oct 19, 2017
Sold by
Leontakianokos Louis P
Bought by
Leontakianokos Louis P and Leontakianokos Stella S
Current Estimated Value
Home Financials for this Owner
Home Financials are based on the most recent Mortgage that was taken out on this home.
Original Mortgage
$216,800
Interest Rate
3.78%
Mortgage Type
New Conventional
Purchase Details
Closed on
Aug 1, 2011
Sold by
Gordon Adam J
Bought by
Leontakianakos Louis P
Home Financials for this Owner
Home Financials are based on the most recent Mortgage that was taken out on this home.
Original Mortgage
$238,600
Interest Rate
4.52%
Mortgage Type
Purchase Money Mortgage
Purchase Details
Closed on
Aug 15, 2005
Sold by
Sullivan Connie
Bought by
Gordon Adam J
Home Financials for this Owner
Home Financials are based on the most recent Mortgage that was taken out on this home.
Original Mortgage
$160,500
Interest Rate
5.54%
Mortgage Type
Purchase Money Mortgage
Create a Home Valuation Report for This Property
The Home Valuation Report is an in-depth analysis detailing your home's value as well as a comparison with similar homes in the area
Home Values in the Area
Average Home Value in this Area
Purchase History
| Date | Buyer | Sale Price | Title Company |
|---|---|---|---|
| Leontakianokos Louis P | -- | -- | |
| Leontakianakos Louis P | -- | -- | |
| Gordon Adam J | -- | -- |
Source: Public Records
Mortgage History
| Date | Status | Borrower | Loan Amount |
|---|---|---|---|
| Closed | Leontakianokos Louis P | $216,800 | |
| Closed | Leontakianakos Louis P | $238,600 | |
| Closed | Gordon Adam J | $160,500 |
Source: Public Records
Tax History Compared to Growth
Tax History
| Year | Tax Paid | Tax Assessment Tax Assessment Total Assessment is a certain percentage of the fair market value that is determined by local assessors to be the total taxable value of land and additions on the property. | Land | Improvement |
|---|---|---|---|---|
| 2024 | $3,997 | $281,500 | $103,800 | $177,700 |
| 2023 | $3,831 | $281,500 | $103,800 | $177,700 |
| 2022 | $3,795 | $281,500 | $103,800 | $177,700 |
| 2021 | $3,660 | $281,500 | $103,800 | $177,700 |
| 2020 | $3,631 | $281,500 | $103,800 | $177,700 |
| 2019 | $3,477 | $199,800 | $69,400 | $130,400 |
| 2018 | $3,061 | $199,800 | $69,400 | $130,400 |
| 2017 | $1,079 | $188,400 | $58,000 | $130,400 |
| 2016 | $3,024 | $188,400 | $58,000 | $130,400 |
| 2015 | $2,952 | $188,400 | $58,000 | $130,400 |
| 2014 | $2,924 | $188,400 | $58,000 | $130,400 |
| 2013 | $2,867 | $188,400 | $58,000 | $130,400 |
Source: Public Records
Map
Nearby Homes
- 7 Fernald Rd
- 197 State Rd
- 100 Shepards Cove Rd Unit F204
- 100 Shepards Cove Rd Unit G204
- 165 Rogers Rd
- 32 Regency Cir Unit 2
- 122 Haley Rd
- 5 Spinney Way Unit 9
- 8 Spruce Point Rd
- 7 Blackberry Place
- 8 Caslyn Dr
- 35 Leach Rd
- 24 Regency Cir Unit 3
- 10 Lewis Rd
- 10-12 Pine St
- 27 Oak Terrace
- 25 Oak Terrace
- 493 Main St
- 20 Mendum Ave
- 12 Gillis Dr Unit 3