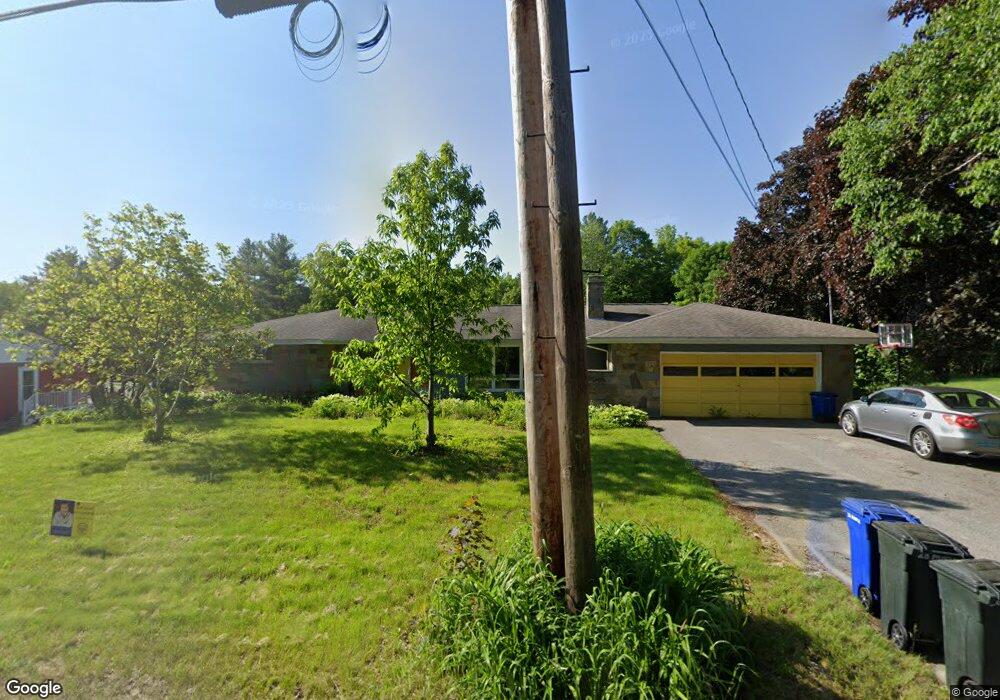
28 Maple St Hallowell, ME 04347
Estimated Value: $366,000 - $487,488
5
Beds
3
Baths
3,058
Sq Ft
$140/Sq Ft
Est. Value
About This Home
This home is located at 28 Maple St, Hallowell, ME 04347 and is currently estimated at $426,622, approximately $139 per square foot. 28 Maple St is a home located in Kennebec County with nearby schools including Dresden Elementary School, Marcia Buker School, and Monmouth Memorial School.
Ownership History
Date
Name
Owned For
Owner Type
Purchase Details
Closed on
Oct 16, 2009
Sold by
Lathe Carla E
Bought by
Oconnor Aimee C
Current Estimated Value
Home Financials for this Owner
Home Financials are based on the most recent Mortgage that was taken out on this home.
Original Mortgage
$243,469
Interest Rate
5.14%
Mortgage Type
Purchase Money Mortgage
Create a Home Valuation Report for This Property
The Home Valuation Report is an in-depth analysis detailing your home's value as well as a comparison with similar homes in the area
Home Values in the Area
Average Home Value in this Area
Purchase History
| Date | Buyer | Sale Price | Title Company |
|---|---|---|---|
| Oconnor Aimee C | -- | -- |
Source: Public Records
Mortgage History
| Date | Status | Borrower | Loan Amount |
|---|---|---|---|
| Closed | Oconnor Aimee C | $243,469 |
Source: Public Records
Tax History
| Year | Tax Paid | Tax Assessment Tax Assessment Total Assessment is a certain percentage of the fair market value that is determined by local assessors to be the total taxable value of land and additions on the property. | Land | Improvement |
|---|---|---|---|---|
| 2024 | $6,231 | $313,100 | $64,600 | $248,500 |
| 2023 | $5,248 | $227,700 | $47,000 | $180,700 |
| 2022 | $5,055 | $227,700 | $47,000 | $180,700 |
| 2021 | $4,850 | $227,700 | $47,000 | $180,700 |
| 2020 | $4,896 | $227,700 | $47,000 | $180,700 |
| 2019 | $4,850 | $227,700 | $47,000 | $180,700 |
| 2018 | $4,486 | $227,700 | $47,000 | $180,700 |
| 2017 | $4,486 | $227,700 | $47,000 | $180,700 |
| 2016 | $4,304 | $227,700 | $47,000 | $180,700 |
| 2015 | $4,053 | $230,300 | $49,600 | $180,700 |
| 2014 | $4,053 | $230,300 | $49,600 | $180,700 |
| 2013 | $3,938 | $230,300 | $49,600 | $180,700 |
Source: Public Records
Map
Nearby Homes
- 707 Maine Ave
- 12 Greenville St
- 40 Harwood Rd
- 85 Middle St Unit 10
- 85 Middle St Unit 12
- 577 Maine Ave
- 228 Water St
- 9 Summer St
- 18 Violet Dr Unit 18
- 192 Water St
- 17 Union St
- TBD Litchfield Rd
- 89 Water St Unit 2
- 15 Middle St Unit 3
- 14 Middle St
- 7 Spring St
- 31 Oakwood Dr
- 74 Second St Unit A
- 0 Winthrop Street Map 6 Lot 15
- 74 River Rd
Your Personal Tour Guide
Ask me questions while you tour the home.