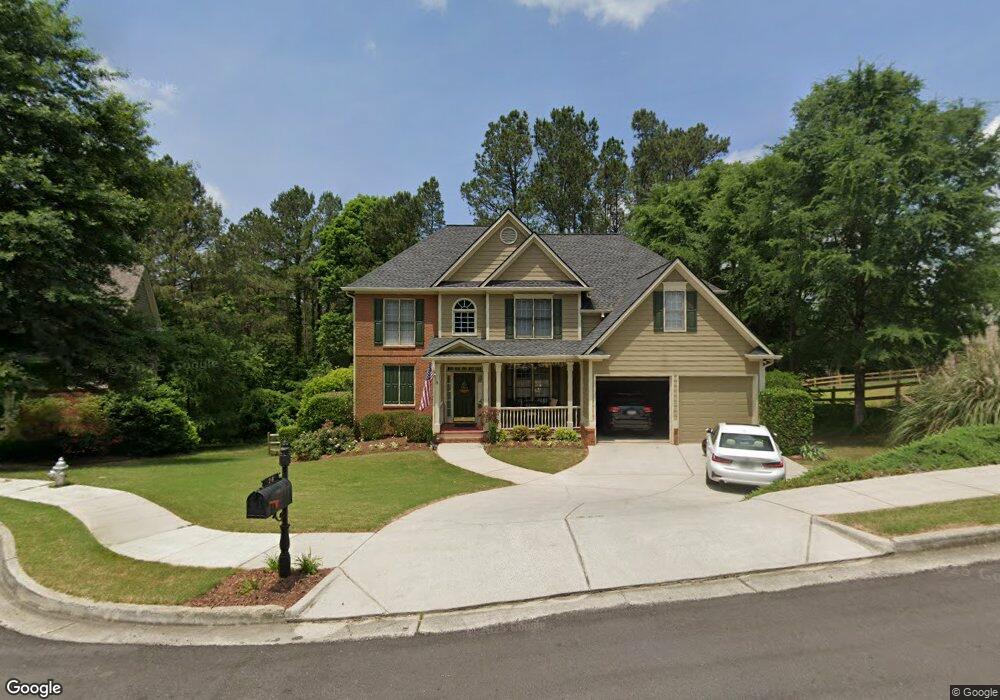
28 McEvers Branch Ct Acworth, GA 30101
Cedarcrest NeighborhoodEstimated Value: $498,000 - $569,545
5
Beds
3
Baths
3,358
Sq Ft
$157/Sq Ft
Est. Value
About This Home
This home is located at 28 McEvers Branch Ct, Acworth, GA 30101 and is currently estimated at $526,136, approximately $156 per square foot. 28 McEvers Branch Ct is a home located in Paulding County with nearby schools including Burnt Hickory Elementary School, Sammy Mcclure Sr. Middle School, and North Paulding High School.
Ownership History
Date
Name
Owned For
Owner Type
Purchase Details
Closed on
Jan 4, 2023
Sold by
Larocca Melinda K
Bought by
Larocca Melinda K and Andrew And Melinda Larocca Irrev Tr
Current Estimated Value
Purchase Details
Closed on
Dec 9, 2022
Sold by
Larocca Melinda K
Bought by
Larocca Melinda K
Purchase Details
Closed on
Jun 27, 2022
Sold by
Larocca Melinda K
Bought by
Larocca Melinda K and Melinda K Larocca Irrevocable Trust
Purchase Details
Closed on
Feb 26, 2010
Sold by
Larocca Andrew P
Bought by
Larocca Andrew P and Larocca Melinda K
Home Financials for this Owner
Home Financials are based on the most recent Mortgage that was taken out on this home.
Original Mortgage
$199,300
Interest Rate
4.97%
Mortgage Type
New Conventional
Purchase Details
Closed on
Jul 21, 2003
Sold by
Hancock Joel R
Bought by
Larocca Andrew P and Larocca Melinda
Home Financials for this Owner
Home Financials are based on the most recent Mortgage that was taken out on this home.
Original Mortgage
$187,200
Interest Rate
3.75%
Mortgage Type
New Conventional
Create a Home Valuation Report for This Property
The Home Valuation Report is an in-depth analysis detailing your home's value as well as a comparison with similar homes in the area
Home Values in the Area
Average Home Value in this Area
Purchase History
| Date | Buyer | Sale Price | Title Company |
|---|---|---|---|
| Larocca Melinda K | -- | -- | |
| Larocca Melinda K | -- | -- | |
| Larocca Melinda K | -- | -- | |
| Larocca Andrew P | -- | -- | |
| Larocca Andrew P | -- | -- | |
| Larocca Andrew P | $234,000 | -- |
Source: Public Records
Mortgage History
| Date | Status | Borrower | Loan Amount |
|---|---|---|---|
| Previous Owner | Larocca Andrew P | $199,300 | |
| Previous Owner | Larocca Andrew P | $187,200 |
Source: Public Records
Tax History Compared to Growth
Tax History
| Year | Tax Paid | Tax Assessment Tax Assessment Total Assessment is a certain percentage of the fair market value that is determined by local assessors to be the total taxable value of land and additions on the property. | Land | Improvement |
|---|---|---|---|---|
| 2024 | $4,217 | $172,748 | $26,000 | $146,748 |
| 2023 | $4,319 | $168,208 | $26,000 | $142,208 |
| 2022 | $3,888 | $151,000 | $26,000 | $125,000 |
| 2021 | $3,444 | $120,364 | $26,000 | $94,364 |
| 2020 | $3,021 | $103,556 | $26,000 | $77,556 |
| 2019 | $3,059 | $103,396 | $26,000 | $77,396 |
| 2018 | $3,151 | $106,464 | $26,000 | $80,464 |
| 2017 | $2,823 | $94,272 | $24,000 | $70,272 |
| 2016 | $2,713 | $91,600 | $24,000 | $67,600 |
| 2015 | $2,464 | $81,920 | $24,000 | $57,920 |
| 2014 | $2,652 | $85,880 | $24,000 | $61,880 |
| 2013 | -- | $78,000 | $24,000 | $54,000 |
Source: Public Records
Map
Nearby Homes
- 280 Graves Rd
- 385 Graves Rd
- 103 Brier Bend Ct Unit D
- 365 Hunt Creek Dr
- 51 Water Oak Dr
- 102 Silverdale Ln
- 88 Water Oak Dr
- 174 Timber Creek #176 Ln SW
- 197 Hickory Pointe Dr
- 139 Thunder Ridge Ln
- 283 Hickory Pointe Dr
- 1039 Lost Creek Pkwy
- 1029 Lost Creek Pkwy
- 1019 Lost Creek Pkwy
- 134 Grove Meadow Dr
- 1009 Lost Creek Pkwy
- 47 Vine Creek Ln
- 1648 Harmony Grove Church Rd
- 140 Arthur Hills Dr
- 291 Harmony Cir
- 38 McEvers Branch Ct
- 815 Bentwater Dr
- 33 McEvers Branch Ct
- 771 Bentwater Dr Unit D
- 42 McEvers Branch Ct
- 29 McEvers Branch Ct
- 843 Bentwater Dr
- 11 McEvers Branch Landing
- 70 Newcomb Trace Unit A
- 770 Bentwater Dr
- 54 Newcomb Trace
- 27 Brier Bend Ct Unit D
- 37 McEvers Branch Landing
- 35 Brier Bend Ct
- 40 Newcomb Trace Unit 51
- 40 Newcomb Trace
- 731 Bentwater Dr
- 850 Bentwater Dr
- 36 McEvers Branch Landing
- 265 Graves Rd