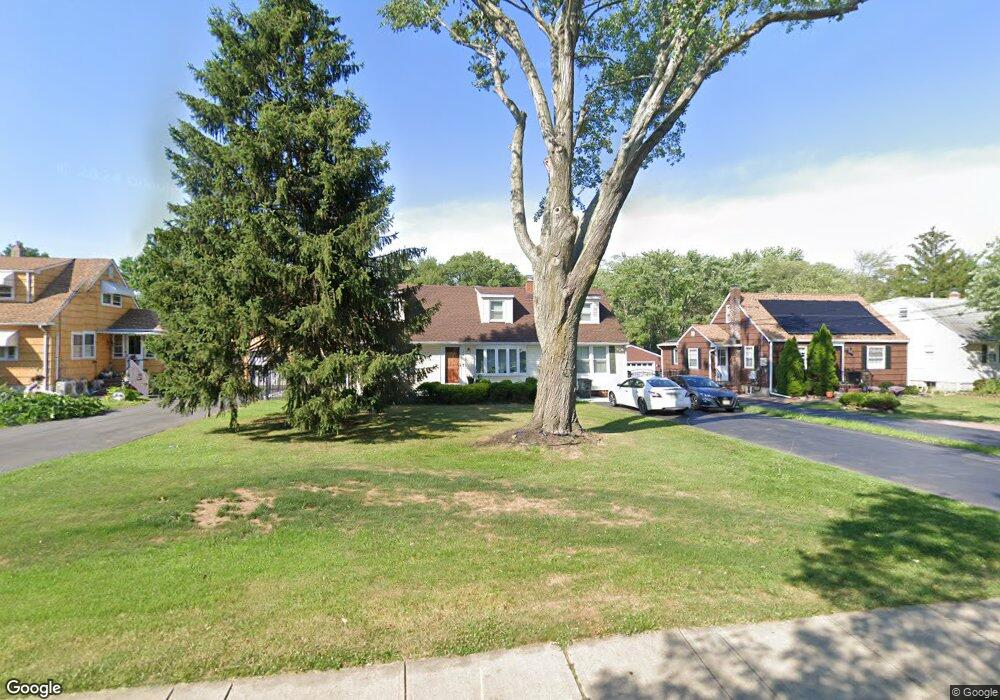
28 Middlesex Rd Matawan, NJ 07747
Estimated Value: $527,000 - $772,000
5
Beds
1
Bath
2,116
Sq Ft
$313/Sq Ft
Est. Value
About This Home
This home is located at 28 Middlesex Rd, Matawan, NJ 07747 and is currently estimated at $662,325, approximately $313 per square foot. 28 Middlesex Rd is a home located in Monmouth County with nearby schools including Matawan Reg High School, Matawan Montessori Academy, and St. Joseph Elementary School.
Ownership History
Date
Name
Owned For
Owner Type
Purchase Details
Closed on
Aug 11, 2005
Sold by
Bonds Gail
Bought by
Bonds Gail
Current Estimated Value
Home Financials for this Owner
Home Financials are based on the most recent Mortgage that was taken out on this home.
Original Mortgage
$203,500
Interest Rate
10.5%
Mortgage Type
Adjustable Rate Mortgage/ARM
Purchase Details
Closed on
Nov 6, 1997
Sold by
Lopez Gilbert
Bought by
Bonds Gail
Home Financials for this Owner
Home Financials are based on the most recent Mortgage that was taken out on this home.
Original Mortgage
$143,000
Interest Rate
7.17%
Mortgage Type
FHA
Purchase Details
Closed on
Oct 5, 1994
Sold by
Soechting Petewr
Bought by
Lopez Gilbert and Lopez Mildred Pagan
Home Financials for this Owner
Home Financials are based on the most recent Mortgage that was taken out on this home.
Original Mortgage
$143,000
Interest Rate
8.55%
Create a Home Valuation Report for This Property
The Home Valuation Report is an in-depth analysis detailing your home's value as well as a comparison with similar homes in the area
Home Values in the Area
Average Home Value in this Area
Purchase History
| Date | Buyer | Sale Price | Title Company |
|---|---|---|---|
| Bonds Gail | -- | -- | |
| Bonds Gail | $145,000 | -- | |
| Lopez Gilbert | $150,000 | -- |
Source: Public Records
Mortgage History
| Date | Status | Borrower | Loan Amount |
|---|---|---|---|
| Previous Owner | Bonds Gail | $203,500 | |
| Previous Owner | Bonds Gail | $143,000 | |
| Previous Owner | Lopez Gilbert | $143,000 |
Source: Public Records
Tax History
| Year | Tax Paid | Tax Assessment Tax Assessment Total Assessment is a certain percentage of the fair market value that is determined by local assessors to be the total taxable value of land and additions on the property. | Land | Improvement |
|---|---|---|---|---|
| 2025 | $10,367 | $582,300 | $252,500 | $329,800 |
| 2024 | $10,266 | $474,900 | $212,500 | $262,400 |
| 2023 | $10,266 | $472,200 | $212,500 | $259,700 |
| 2022 | $10,537 | $409,800 | $162,500 | $247,300 |
| 2021 | $7,834 | $387,800 | $162,500 | $225,300 |
| 2020 | $10,263 | $375,100 | $152,500 | $222,600 |
| 2019 | $10,090 | $369,600 | $152,500 | $217,100 |
| 2018 | $10,181 | $366,900 | $152,500 | $214,400 |
| 2017 | $10,210 | $362,700 | $152,500 | $210,200 |
| 2016 | $10,059 | $365,000 | $157,500 | $207,500 |
| 2015 | $9,400 | $343,700 | $157,500 | $186,200 |
| 2014 | $9,540 | $350,100 | $157,500 | $192,600 |
Source: Public Records
Map
Nearby Homes
- 27 Middlesex Rd
- 49 Middlesex Rd Unit B
- 49 Middlesex Rd Unit A
- 45 Beechwood Terrace
- 101 Ravine Dr
- 65 Ravine Dr
- 155 Penn Ct Unit 136
- 255 Harding Blvd
- 9 Crabtree Rd
- 4377 Old Bridge Matawan Rd
- 259 Matawan Ave
- 33 Samantha Cir
- 97D Aberdeen Rd
- 2 Cliffwood Ave
- 258 Jackson St
- 190 Jackson St
- 15 Walnut Ct
- 9 Fountain Ave
- 272 Main St
- 48 Charles St
- 26 Middlesex Rd
- 30 Middlesex Rd
- 24 Middlesex Rd
- 22 Middlesex Rd
- 32 Middlesex Rd
- 25 Middlesex Rd
- 23 Middlesex Rd
- 20 Middlesex Rd
- 21 Middlesex Rd
- 34 Middlesex Rd
- 29 Middlesex Rd
- 19 Middlesex Rd
- 17 Middlesex Rd
- 18 Middlesex Rd
- 36 Middlesex Rd
- 3 Matawan Green Ln
- 2 Matawan Green Ln
- 31 Middlesex Rd
- 4 Matawan Green Ln
- 1 Matawan Green Ln
Your Personal Tour Guide
Ask me questions while you tour the home.