28 N 4th St Cheney, WA 99004
Estimated Value: $328,000 - $384,000
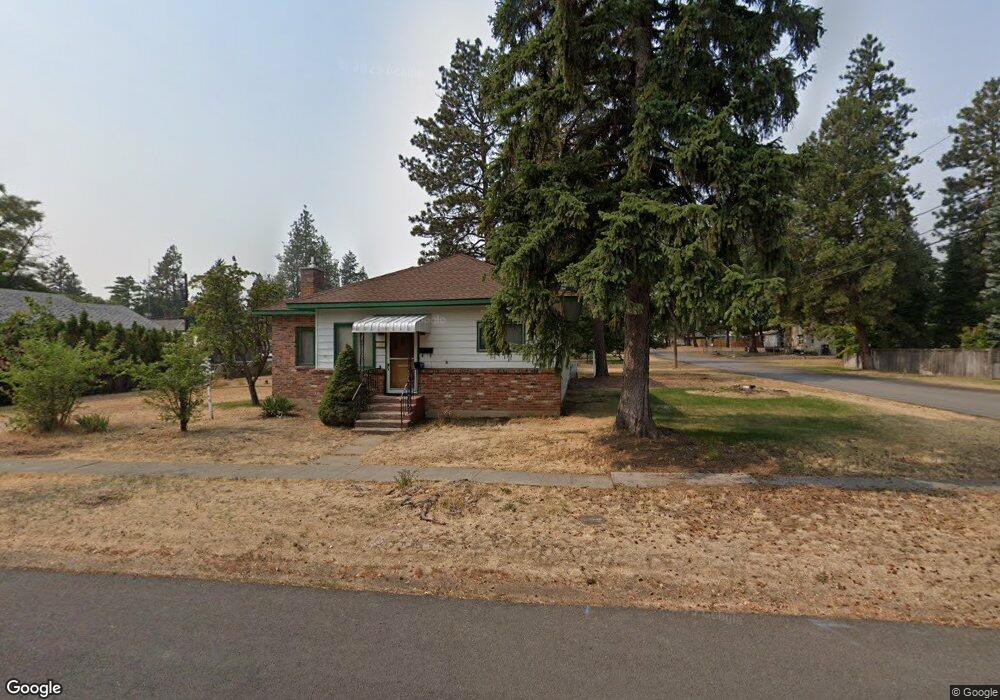
About This Home
This home is located at 28 N 4th St, Cheney, WA 99004 and is currently estimated at $358,397, approximately $168 per square foot. 28 N 4th St is a home located in Spokane County with nearby schools including Betz Elementary School, Cheney Middle School, and Cheney High School.
Ownership History
We collect this data history from publicly available records. To have your information removed, we recommend requesting removal directly through your county’s website.
Purchase Details
Purchase Details
Purchase Details
Home Financials for this Owner
Home Financials are based on the most recent Mortgage that was taken out on this home.Purchase History
We collect this data history from publicly available records. To have your information removed, we recommend requesting removal directly through your county’s website.
| Date | Buyer | Sale Price | Title Company |
|---|---|---|---|
| -- | None Available | ||
| $110,000 | First American Title Ins | ||
| $98,000 | First American Title Ins |
Mortgage History
We collect this data history from publicly available records. To have your information removed, we recommend requesting removal directly through your county’s website.
| Date | Status | Borrower | Loan Amount |
|---|---|---|---|
| Previous Owner | $78,000 |
Tax History
We collect this data history from publicly available records. To have your information removed, we recommend requesting removal directly through your county’s website.
| Year | Tax Paid | Tax Assessment Tax Assessment Total Assessment is a certain percentage of the fair market value that is determined by local assessors to be the total taxable value of land and additions on the property. | Land | Improvement |
|---|---|---|---|---|
| 2025 | $3,469 | $328,900 | $80,000 | $248,900 |
| 2024 | $3,469 | $314,600 | $80,000 | $234,600 |
| 2023 | $2,861 | $347,300 | $80,000 | $267,300 |
| 2022 | $2,807 | $341,400 | $80,000 | $261,400 |
| 2021 | $2,827 | $247,200 | $42,000 | $205,200 |
| 2020 | $2,691 | $220,500 | $40,000 | $180,500 |
| 2019 | $2,256 | $194,400 | $40,000 | $154,400 |
| 2018 | $2,488 | $186,700 | $40,000 | $146,700 |
| 2017 | $2,161 | $179,100 | $40,000 | $139,100 |
| 2016 | $2,168 | $173,100 | $40,000 | $133,100 |
| 2015 | $2,031 | $164,900 | $40,000 | $124,900 |
| 2014 | -- | $164,900 | $40,000 | $124,900 |
| 2013 | -- | $0 | $0 | $0 |
Map
- 113 N 4th St
- 3 N 3rd St
- 916 2nd St Unit 918
- 1239 1st St
- 706 2nd St
- 1521 4th St
- 317 College Ave
- 422 4th St
- 5339 W Anderson Rd
- 1717 2nd St
- 500 N 9th St
- 506 N 9th St
- 323 5th St
- 11819 Washington 904
- 1820 5th St
- 2319 Annie Place
- 2402 Annie Place
- 2331 Annie Place Unit Lot 12 Block 3 - Sno
- 2323 Annie Place Unit Lot 13 Block 3 - Wat
- 2312 Annie Place
Ask me questions while you tour the home.