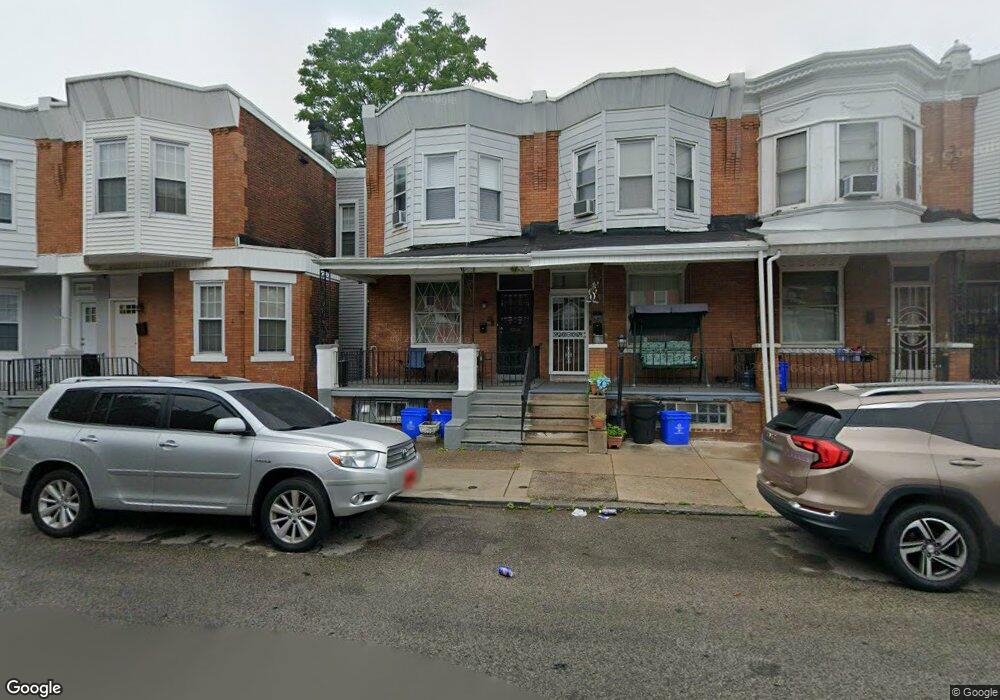
28 N 53rd St Philadelphia, PA 19139
Haddington NeighborhoodEstimated Value: $91,000 - $175,674
3
Beds
1
Bath
1,320
Sq Ft
$105/Sq Ft
Est. Value
About This Home
This home is located at 28 N 53rd St, Philadelphia, PA 19139 and is currently estimated at $138,169, approximately $104 per square foot. 28 N 53rd St is a home located in Philadelphia County with nearby schools including Alain Locke School, West Philadelphia High School, and Global Leadership Academy Charter School Southwest.
Ownership History
Date
Name
Owned For
Owner Type
Purchase Details
Closed on
Sep 26, 2023
Sold by
Witherspoon Hervey
Bought by
2727 Llc
Current Estimated Value
Purchase Details
Closed on
Aug 6, 2021
Sold by
Graham Dorothy and Graham Bessie
Bought by
Witherspoon Hervey
Purchase Details
Closed on
Dec 12, 1994
Sold by
Easton Muriel Childs and Childs Mamie C
Bought by
Easton Muriel Childs
Purchase Details
Closed on
Jul 28, 1989
Bought by
Graham Bessie and Graham Dorothy
Create a Home Valuation Report for This Property
The Home Valuation Report is an in-depth analysis detailing your home's value as well as a comparison with similar homes in the area
Home Values in the Area
Average Home Value in this Area
Purchase History
| Date | Buyer | Sale Price | Title Company |
|---|---|---|---|
| 2727 Llc | $73,000 | None Listed On Document | |
| Witherspoon Hervey | -- | None Listed On Document | |
| Easton Muriel Childs | -- | -- | |
| Graham Bessie | $30,000 | -- |
Source: Public Records
Tax History Compared to Growth
Tax History
| Year | Tax Paid | Tax Assessment Tax Assessment Total Assessment is a certain percentage of the fair market value that is determined by local assessors to be the total taxable value of land and additions on the property. | Land | Improvement |
|---|---|---|---|---|
| 2026 | $1,146 | $114,800 | $22,960 | $91,840 |
| 2025 | $1,146 | $114,800 | $22,960 | $91,840 |
| 2024 | $1,146 | $114,800 | $22,960 | $91,840 |
| 2023 | $1,146 | $81,900 | $16,380 | $65,520 |
| 2022 | $710 | $81,900 | $16,380 | $65,520 |
| 2021 | $710 | $0 | $0 | $0 |
| 2020 | $710 | $0 | $0 | $0 |
| 2019 | $683 | $0 | $0 | $0 |
| 2018 | $696 | $0 | $0 | $0 |
| 2017 | $696 | $0 | $0 | $0 |
| 2016 | $696 | $0 | $0 | $0 |
| 2015 | $890 | $0 | $0 | $0 |
| 2014 | -- | $66,400 | $5,146 | $61,254 |
| 2012 | -- | $6,464 | $1,415 | $5,049 |
Source: Public Records
Map
Nearby Homes