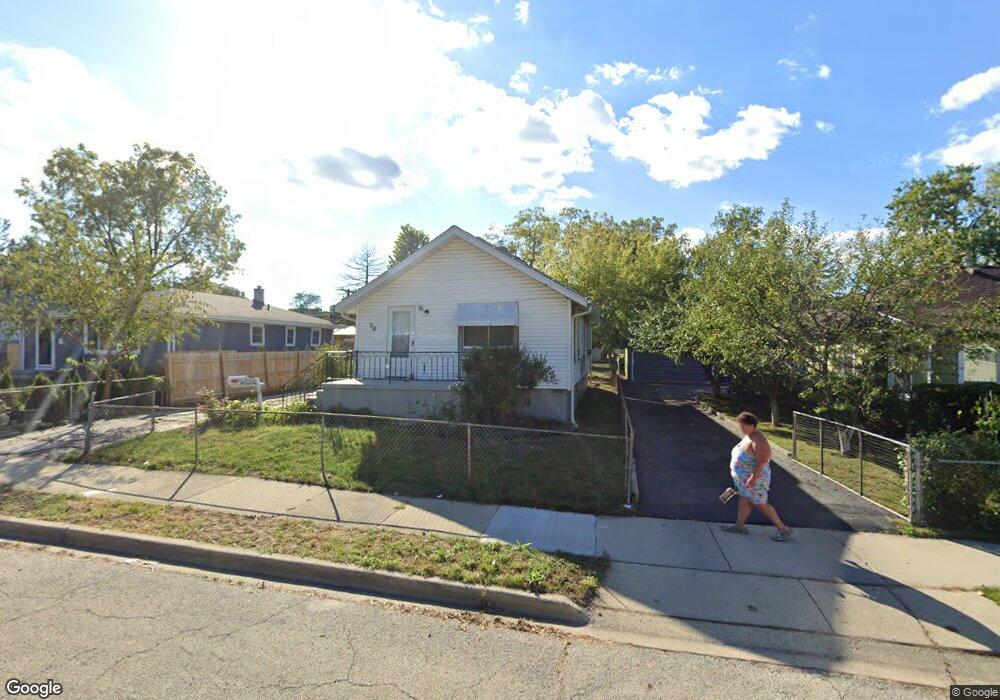
28 N Orchard Ave Waukegan, IL 60085
Estimated Value: $199,000 - $225,000
3
Beds
2
Baths
924
Sq Ft
$228/Sq Ft
Est. Value
About This Home
This home is located at 28 N Orchard Ave, Waukegan, IL 60085 and is currently estimated at $211,062, approximately $228 per square foot. 28 N Orchard Ave is a home located in Lake County with nearby schools including Whittier Elementary School, Robert E. Abbott Middle School, and Waukegan High School.
Ownership History
Date
Name
Owned For
Owner Type
Purchase Details
Closed on
Jun 19, 2014
Sold by
Hernandez
Bought by
Munoz Jesus
Current Estimated Value
Purchase Details
Closed on
Jul 18, 2005
Sold by
Rizvi Asim Raza
Bought by
Rocha Cristobal and Ceja Emilia
Home Financials for this Owner
Home Financials are based on the most recent Mortgage that was taken out on this home.
Original Mortgage
$133,000
Interest Rate
8.25%
Mortgage Type
Purchase Money Mortgage
Purchase Details
Closed on
Nov 19, 1999
Sold by
Ahmad Manzoor and Ahmad Shahnaz
Bought by
Rizvi Asim Raza
Home Financials for this Owner
Home Financials are based on the most recent Mortgage that was taken out on this home.
Original Mortgage
$92,400
Interest Rate
7.9%
Purchase Details
Closed on
Nov 12, 1999
Sold by
Ortiz Jacinto L and Ortiz Sylvia S
Bought by
Ahmad Manzoor and Ahmad Shahnaz
Home Financials for this Owner
Home Financials are based on the most recent Mortgage that was taken out on this home.
Original Mortgage
$92,400
Interest Rate
7.9%
Create a Home Valuation Report for This Property
The Home Valuation Report is an in-depth analysis detailing your home's value as well as a comparison with similar homes in the area
Home Values in the Area
Average Home Value in this Area
Purchase History
| Date | Buyer | Sale Price | Title Company |
|---|---|---|---|
| Munoz Jesus | $39,000 | None Available | |
| Rocha Cristobal | $140,000 | Ticor Title Insurance Compan | |
| Rizvi Asim Raza | $97,500 | First American Title | |
| Ahmad Manzoor | $95,000 | First American Title |
Source: Public Records
Mortgage History
| Date | Status | Borrower | Loan Amount |
|---|---|---|---|
| Previous Owner | Rocha Cristobal | $133,000 | |
| Previous Owner | Rizvi Asim Raza | $92,400 |
Source: Public Records
Tax History Compared to Growth
Tax History
| Year | Tax Paid | Tax Assessment Tax Assessment Total Assessment is a certain percentage of the fair market value that is determined by local assessors to be the total taxable value of land and additions on the property. | Land | Improvement |
|---|---|---|---|---|
| 2024 | $4,244 | $50,265 | $11,278 | $38,987 |
| 2023 | $3,828 | $45,003 | $10,097 | $34,906 |
| 2022 | $3,828 | $39,158 | $8,591 | $30,567 |
| 2021 | $3,759 | $36,054 | $7,947 | $28,107 |
| 2020 | $3,808 | $33,589 | $7,404 | $26,185 |
| 2019 | $3,832 | $30,779 | $6,785 | $23,994 |
| 2018 | $3,401 | $26,303 | $8,730 | $17,573 |
| 2017 | $3,310 | $23,271 | $7,724 | $15,547 |
| 2016 | $3,125 | $20,222 | $6,712 | $13,510 |
| 2015 | $3,057 | $18,099 | $6,007 | $12,092 |
| 2014 | $2,205 | $18,572 | $5,431 | $13,141 |
| 2012 | $2,953 | $20,121 | $5,884 | $14,237 |
Source: Public Records
Map
Nearby Homes
- 0 Brookside Ave
- 24 Washington Terrace
- 302 S Martin Ave
- 411 N Martin Ave
- 2115 Lydia St
- 2029 Lloyd Ave
- 2524 Gray Ct
- 2116 & 2101 Williamsburg Dr
- 12601 W Atlantic Ave
- 33 Worack Place
- 1620 Hyde Park Ave
- 1416 Hamilton Ct
- 1213 Grand Ave
- 2917 Hyde Park Ave
- 806 Leith Ave
- 509 N Butrick St
- 23 N Jackson St
- 3170 W Monroe St Unit 309
- 633 S Fulton Ave
- 1022 S Elmwood Ave
- 32 N Orchard Ave
- 24 N Orchard Ave
- 36 N Orchard Ave
- 20 N Orchard Ave
- 25 N Sumac Ave
- 29 N Sumac Ave
- 38 N Orchard Ave
- 33 N Sumac Ave
- 23 N Sumac Ave
- 17 N Sumac Ave
- 37 N Sumac Ave
- 25 N Orchard Ave
- 31 N Orchard Ave
- 44 N Orchard Ave
- 33 N Orchard Ave
- 21 N Orchard Ave
- 13 N Sumac Ave
- 41 N Sumac Ave
- 35 N Orchard Ave
- 2310 Washington St