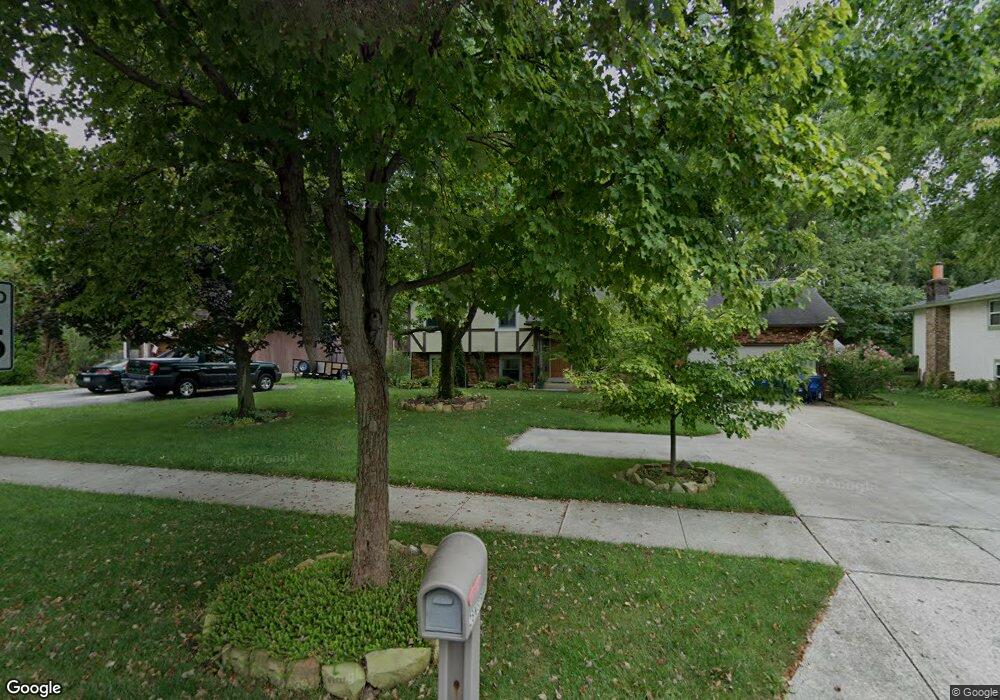
28 N Spring Rd Westerville, OH 43081
Estimated Value: $363,000 - $384,402
4
Beds
2
Baths
1,714
Sq Ft
$218/Sq Ft
Est. Value
About This Home
This home is located at 28 N Spring Rd, Westerville, OH 43081 and is currently estimated at $374,351, approximately $218 per square foot. 28 N Spring Rd is a home located in Franklin County with nearby schools including Mark Twain Elementary School, Walnut Springs Middle School, and Westerville-North High School.
Ownership History
Date
Name
Owned For
Owner Type
Purchase Details
Closed on
May 3, 2017
Sold by
Johnson James C and Johnson Sara J
Bought by
Johnson James C and Johnson Sara J
Current Estimated Value
Purchase Details
Closed on
Sep 9, 2003
Sold by
Gilliland Johnson Jennifer
Bought by
Johnson James C
Purchase Details
Closed on
Feb 7, 2001
Sold by
Mull Winebrenner Winebrenner Terry L and Mull Brenda L
Bought by
Johnson James C and Gilliland Johnson Jennifer J
Home Financials for this Owner
Home Financials are based on the most recent Mortgage that was taken out on this home.
Original Mortgage
$100,000
Outstanding Balance
$36,175
Interest Rate
7.1%
Mortgage Type
Seller Take Back
Estimated Equity
$338,176
Purchase Details
Closed on
Feb 19, 1993
Bought by
Winebrenner Terry L and Winebrenner Bre
Purchase Details
Closed on
Aug 4, 1987
Create a Home Valuation Report for This Property
The Home Valuation Report is an in-depth analysis detailing your home's value as well as a comparison with similar homes in the area
Home Values in the Area
Average Home Value in this Area
Purchase History
| Date | Buyer | Sale Price | Title Company |
|---|---|---|---|
| Johnson James C | -- | None Available | |
| Johnson James C | -- | -- | |
| Johnson James C | $144,000 | -- | |
| Winebrenner Terry L | $108,000 | -- | |
| -- | $93,000 | -- |
Source: Public Records
Mortgage History
| Date | Status | Borrower | Loan Amount |
|---|---|---|---|
| Open | Johnson James C | $100,000 |
Source: Public Records
Tax History Compared to Growth
Tax History
| Year | Tax Paid | Tax Assessment Tax Assessment Total Assessment is a certain percentage of the fair market value that is determined by local assessors to be the total taxable value of land and additions on the property. | Land | Improvement |
|---|---|---|---|---|
| 2024 | $5,932 | $104,370 | $31,500 | $72,870 |
| 2023 | $5,806 | $104,370 | $31,500 | $72,870 |
| 2022 | $5,730 | $78,650 | $21,000 | $57,650 |
| 2021 | $5,778 | $78,650 | $21,000 | $57,650 |
| 2020 | $5,762 | $78,650 | $21,000 | $57,650 |
| 2019 | $5,098 | $65,700 | $17,500 | $48,200 |
| 2018 | $4,774 | $65,700 | $17,500 | $48,200 |
| 2017 | $5,014 | $65,700 | $17,500 | $48,200 |
| 2016 | $4,698 | $56,040 | $18,380 | $37,660 |
| 2015 | $4,551 | $56,040 | $18,380 | $37,660 |
| 2014 | $4,554 | $56,040 | $18,380 | $37,660 |
| 2013 | $2,166 | $53,375 | $17,500 | $35,875 |
Source: Public Records
Map
Nearby Homes
- 768 Collingwood Dr
- 192 Buckeye Ct
- 912 Lakeway Ct E
- 589 E College Ave
- 200 Matthew Ave
- 974 Lakeland Dr
- 90 Spring Creek Dr
- 182 Hillcrest Dr
- 150 Matthew Ave
- 73 Keethler Dr S
- 718 Sugar Ct
- 969 Farrington Dr
- 417 E Park St
- 368 E College Ave
- 371 Delaware Dr
- 364 E College Ave
- 539 Cherrington Rd
- 360 Potawatomi Dr
- 1155 Ashford Ct
- 0 Cherrington Rd Unit 225023909
- 20 N Spring Rd
- 36 N Spring Rd
- 861 Prince William Ln
- 857 Prince William Ln
- 44 N Spring Rd
- 806 E College Ave
- 853 Prince William Ln
- 863 Prince William Ln
- 816 E College Ave
- 56 N Spring Rd
- 845 Prince William Ln
- 796 E College Ave
- 43 N Spring Rd
- 793 Rebecca Ave
- 824 E College Ave
- 865 Prince William Ln
- 860 Prince William Ln
- 64 N Spring Rd
- 841 Prince William Ln
- 854 Prince William Ln