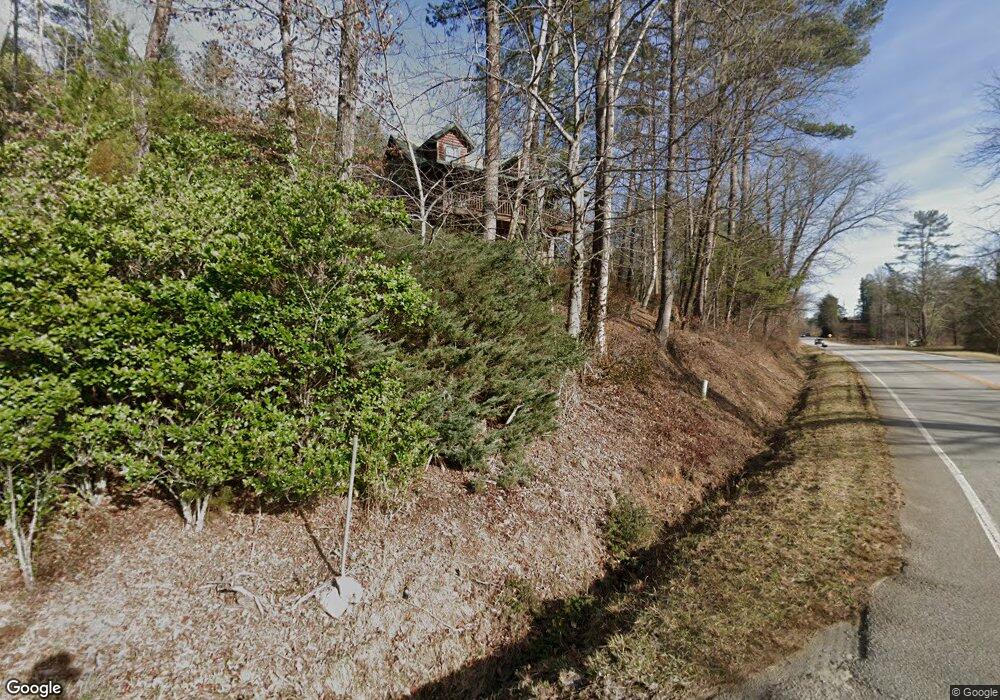
28 New Hope Rd Clayton, GA 30525
Estimated Value: $282,000 - $393,000
4
Beds
2
Baths
1,536
Sq Ft
$227/Sq Ft
Est. Value
About This Home
This home is located at 28 New Hope Rd, Clayton, GA 30525 and is currently estimated at $349,036, approximately $227 per square foot. 28 New Hope Rd is a home located in Rabun County with nearby schools including Rabun County Primary School and Rabun County High School.
Ownership History
Date
Name
Owned For
Owner Type
Purchase Details
Closed on
Feb 12, 2021
Sold by
Matthews Dennis Clay
Bought by
Matthews Dennis Clay and Anderson Christie Lynn
Current Estimated Value
Purchase Details
Closed on
Jan 29, 2020
Sold by
Adkins Patrick
Bought by
Matthews Dennis Clay
Home Financials for this Owner
Home Financials are based on the most recent Mortgage that was taken out on this home.
Original Mortgage
$152,910
Interest Rate
3.72%
Mortgage Type
New Conventional
Purchase Details
Closed on
Jul 30, 2012
Sold by
Robin L Adkins
Bought by
Adkins Patrick
Purchase Details
Closed on
Oct 31, 2008
Sold by
Not Provided
Bought by
Adkins Robin L and Watkins Lloyd Thomas
Purchase Details
Closed on
Jan 1, 2006
Sold by
Not Provided
Bought by
Adkins Robin L and Watkins Lloyd Thomas
Purchase Details
Closed on
Aug 1, 2002
Create a Home Valuation Report for This Property
The Home Valuation Report is an in-depth analysis detailing your home's value as well as a comparison with similar homes in the area
Home Values in the Area
Average Home Value in this Area
Purchase History
| Date | Buyer | Sale Price | Title Company |
|---|---|---|---|
| Matthews Dennis Clay | -- | -- | |
| Matthews Dennis Clay | -- | -- | |
| Matthews Dennis Clay | $169,900 | -- | |
| Matthews Dennis Clay | $169,900 | -- | |
| Adkins Patrick | -- | -- | |
| Adkins Patrick | -- | -- | |
| Adkins Robin L | -- | -- | |
| Adkins Robin L | -- | -- | |
| Adkins Robin L | -- | -- | |
| Adkins Robin L | -- | -- | |
| -- | $540,000 | -- | |
| -- | $540,000 | -- |
Source: Public Records
Mortgage History
| Date | Status | Borrower | Loan Amount |
|---|---|---|---|
| Previous Owner | Matthews Dennis Clay | $152,910 |
Source: Public Records
Tax History Compared to Growth
Tax History
| Year | Tax Paid | Tax Assessment Tax Assessment Total Assessment is a certain percentage of the fair market value that is determined by local assessors to be the total taxable value of land and additions on the property. | Land | Improvement |
|---|---|---|---|---|
| 2025 | $1,463 | $91,174 | $4,000 | $87,174 |
| 2024 | $1,382 | $86,081 | $4,000 | $82,081 |
| 2023 | $1,420 | $77,592 | $4,000 | $73,592 |
| 2022 | $1,374 | $75,046 | $4,000 | $71,046 |
| 2021 | $1,266 | $67,528 | $4,000 | $63,528 |
| 2020 | $1,264 | $65,171 | $4,000 | $61,171 |
| 2019 | $1,100 | $56,329 | $5,000 | $51,329 |
| 2018 | $1,104 | $56,329 | $5,000 | $51,329 |
| 2017 | $1,088 | $57,884 | $5,000 | $52,884 |
| 2016 | $1,025 | $54,366 | $4,000 | $50,366 |
| 2015 | $1,030 | $53,472 | $4,000 | $49,472 |
| 2014 | $1,035 | $53,472 | $4,000 | $49,472 |
Source: Public Records
Map
Nearby Homes
- LOT 16 Brown Hawk Dr
- 52 Breton Highlands Ct
- 0 Brown Hawk Unit 10495084
- 0 Brown Hawk Unit 7555224
- 0 Kingwood Court Ln Unit 10628599
- 104 Kingwood Court Ln
- 420 Hidden Acres Ln
- 37 Begonia Ct
- 10 Quiet Place Ln
- 31 Creekside Ln
- 0 Kingwood Dr Unit LOT 104CC 10359599
- 0 Kingwood Dr Unit 10607215
- 251 Shakespeare Dr Unit 321
- 251 Shakespeare Dr Unit 332
- 112 Gleneagle Ct Unit D202
- 0 Timber Creek Dr Unit 10616920
- 20 Gleneagle Ct Unit BUILDING A UNIT 102
- 20 Gleneagle Ct Unit 303A
- 00 Mattie McCall Ln
- 0 King Mtn Dr Unit 10203369
- 540 New Hope Church Rd
- 481 New Hope Church Rd
- 62 Crooked Branch Rd
- 542 New Hope Church Rd
- 62 Crooked Branch Dr Unit 4BB
- 82 Crooked Branch
- 82 Crooked Branch Dr
- 73 Crooked Branch Dr
- 0 New Hope Church Rd Unit 33 - 40 7104360
- 42 Crooked Branch Dr
- 362 Kingwood Dr
- 410 Kingwood Dr Unit 12
- 410 Kingwood Dr
- 296 Brown Hawk Dr Unit EE 13
- 296 Brown Hawk Dr
- 9 Breton Highlands Ct
- 9 Breton Highlands Ct Unit 116BB
- 114 Breton Highlands Unit 114BB
- 16 Brown Hawk Unit 16DD
- 377 Kingwood Dr