28 North St Fairhaven, MA 02719
Oxford NeighborhoodEstimated Value: $515,892 - $597,000
3
Beds
2
Baths
1,850
Sq Ft
$299/Sq Ft
Est. Value
About This Home
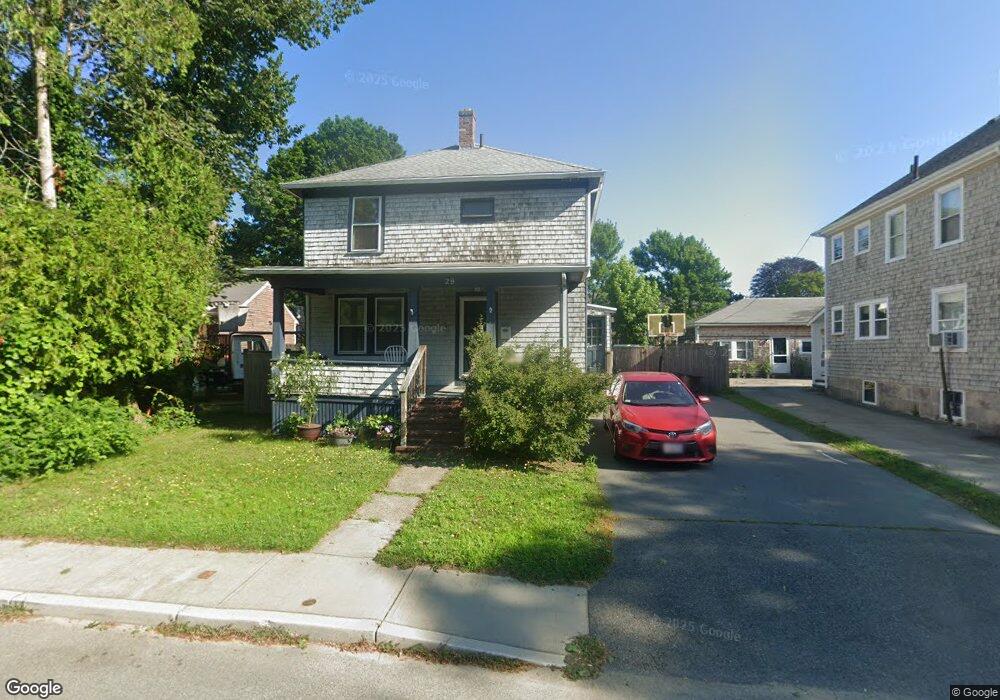
This home is located at 28 North St, Fairhaven, MA 02719 and is currently estimated at $553,223, approximately $299 per square foot. 28 North St is a home located in Bristol County with nearby schools including Fairhaven High School, Alma Del Mar Charter School, and City On A Hill Charter Public School New Bedford.
Ownership History
Date
Name
Owned For
Owner Type
Purchase Details
Closed on
Jun 29, 2010
Sold by
Herman Todd A and Herman Cheryl F
Bought by
Pimentel Kate C and Pimentel Eric A
Current Estimated Value
Home Financials for this Owner
Home Financials are based on the most recent Mortgage that was taken out on this home.
Original Mortgage
$264,438
Outstanding Balance
$177,992
Interest Rate
4.98%
Mortgage Type
Purchase Money Mortgage
Estimated Equity
$375,231
Purchase Details
Closed on
Nov 24, 2003
Sold by
Souza James T and Souza Susan J
Bought by
Herman Cheryl F and Herman Todd A
Home Financials for this Owner
Home Financials are based on the most recent Mortgage that was taken out on this home.
Original Mortgage
$220,000
Interest Rate
5.98%
Mortgage Type
Purchase Money Mortgage
Create a Home Valuation Report for This Property
The Home Valuation Report is an in-depth analysis detailing your home's value as well as a comparison with similar homes in the area
Home Values in the Area
Average Home Value in this Area
Purchase History
| Date | Buyer | Sale Price | Title Company |
|---|---|---|---|
| Pimentel Kate C | $268,000 | -- | |
| Herman Cheryl F | $275,000 | -- |
Source: Public Records
Mortgage History
| Date | Status | Borrower | Loan Amount |
|---|---|---|---|
| Open | Herman Cheryl F | $264,438 | |
| Closed | Herman Cheryl F | $44,099 | |
| Previous Owner | Herman Cheryl F | $220,000 | |
| Previous Owner | Herman Cheryl F | $25,000 |
Source: Public Records
Tax History
| Year | Tax Paid | Tax Assessment Tax Assessment Total Assessment is a certain percentage of the fair market value that is determined by local assessors to be the total taxable value of land and additions on the property. | Land | Improvement |
|---|---|---|---|---|
| 2025 | $39 | $423,700 | $169,600 | $254,100 |
| 2024 | $4,137 | $448,200 | $169,600 | $278,600 |
| 2023 | $4,034 | $405,400 | $148,600 | $256,800 |
| 2022 | $3,938 | $385,300 | $138,000 | $247,300 |
| 2021 | $2,246 | $323,400 | $124,900 | $198,500 |
| 2020 | $3,577 | $323,400 | $124,900 | $198,500 |
| 2019 | $2,942 | $287,400 | $103,600 | $183,800 |
| 2018 | $3,698 | $268,100 | $98,600 | $169,500 |
| 2017 | $3,063 | $251,700 | $98,600 | $153,100 |
| 2016 | $2,910 | $238,900 | $98,600 | $140,300 |
| 2015 | $2,847 | $234,300 | $98,600 | $135,700 |
Source: Public Records
Map
Nearby Homes
- 24 Academy Ave
- 442 Dana Farms
- 14 Sycamore St
- 313 Main St
- 15 School St
- 16 Ash St
- 253 Adams St
- 10 Livesey Pkwy
- 39 Christian St
- 71 Sycamore St
- 77 Adams St
- 0 Nulands Neck Unit 73286360
- 8 Washington St
- 145 Pleasant St
- 58 Washington St
- 24 Middle St
- 34 Washburn St Unit 36
- 24 Cotter St
- 7 Deerfield Ln
- 17 Campbell St
Your Personal Tour Guide
Ask me questions while you tour the home.