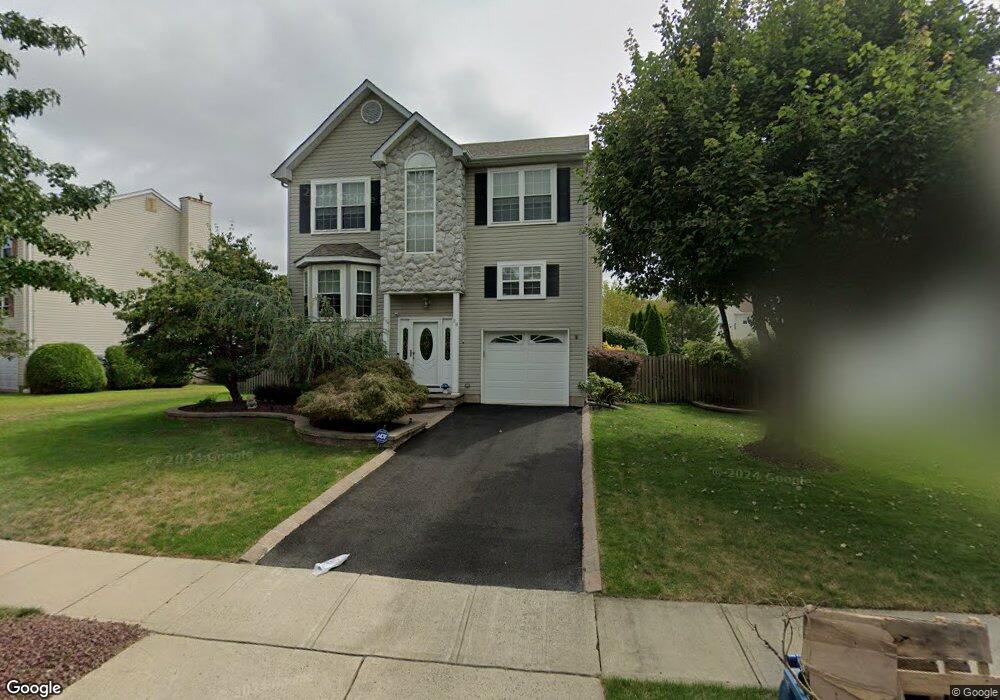
28 North St Old Bridge, NJ 08857
Estimated Value: $742,257 - $840,000
4
Beds
3
Baths
2,600
Sq Ft
$311/Sq Ft
Est. Value
About This Home
This home is located at 28 North St, Old Bridge, NJ 08857 and is currently estimated at $809,064, approximately $311 per square foot. 28 North St is a home located in Middlesex County with nearby schools including Old Bridge High School, St. Thomas the Apostle School, and Immaculate Conception School.
Ownership History
Date
Name
Owned For
Owner Type
Purchase Details
Closed on
Nov 19, 2018
Sold by
Maria Pafundi Richard and Maria Skefalidas
Bought by
Pafundi Richard
Current Estimated Value
Purchase Details
Closed on
Apr 30, 2008
Sold by
Kerwin Andrew and Kerwin Dana
Bought by
Pafundi Richard and Skefalidas Maria
Home Financials for this Owner
Home Financials are based on the most recent Mortgage that was taken out on this home.
Original Mortgage
$364,000
Outstanding Balance
$231,122
Interest Rate
5.93%
Mortgage Type
Purchase Money Mortgage
Estimated Equity
$577,942
Purchase Details
Closed on
Mar 14, 1997
Sold by
Lowell Manor
Bought by
Kerwin Andrew and Kerwin Dana
Home Financials for this Owner
Home Financials are based on the most recent Mortgage that was taken out on this home.
Original Mortgage
$140,000
Interest Rate
7.59%
Create a Home Valuation Report for This Property
The Home Valuation Report is an in-depth analysis detailing your home's value as well as a comparison with similar homes in the area
Home Values in the Area
Average Home Value in this Area
Purchase History
| Date | Buyer | Sale Price | Title Company |
|---|---|---|---|
| Pafundi Richard | -- | None Available | |
| Pafundi Richard | $455,000 | None Available | |
| Kerwin Andrew | $177,900 | -- |
Source: Public Records
Mortgage History
| Date | Status | Borrower | Loan Amount |
|---|---|---|---|
| Open | Pafundi Richard | $364,000 | |
| Previous Owner | Kerwin Andrew | $140,000 |
Source: Public Records
Tax History Compared to Growth
Tax History
| Year | Tax Paid | Tax Assessment Tax Assessment Total Assessment is a certain percentage of the fair market value that is determined by local assessors to be the total taxable value of land and additions on the property. | Land | Improvement |
|---|---|---|---|---|
| 2025 | $10,153 | $179,800 | $56,500 | $123,300 |
| 2024 | $9,740 | $179,800 | $56,500 | $123,300 |
| 2023 | $9,740 | $179,800 | $56,500 | $123,300 |
| 2022 | $9,517 | $179,800 | $56,500 | $123,300 |
| 2021 | $6,985 | $179,800 | $56,500 | $123,300 |
| 2020 | $9,236 | $179,800 | $56,500 | $123,300 |
| 2019 | $9,080 | $179,800 | $56,500 | $123,300 |
| 2018 | $8,979 | $179,800 | $56,500 | $123,300 |
| 2017 | $8,688 | $179,800 | $56,500 | $123,300 |
| 2016 | $8,508 | $179,800 | $56,500 | $123,300 |
| 2015 | $8,361 | $179,800 | $56,500 | $123,300 |
| 2014 | $8,276 | $179,800 | $56,500 | $123,300 |
Source: Public Records
Map
Nearby Homes
- 14 Brookside Ave
- 37 Shirley Blvd
- 44 Shirley Blvd
- 306 Austin Ave
- 1210 Englishtown Rd
- 296 Herbert Ave
- 12 Brookside Rd
- 269 Park Ave
- 5 Elaine Ct
- 289 Main St Unit 2N
- 289 Main St Unit 9R
- 289 Main St Unit 6E
- 289 Main St Unit 10F
- 289 Main St Unit 4Q
- 289 Main St Unit 10N
- 25 Evergreen St
- 205 Main St
- 11 Macarthur Ave
- 98 Madison Ave
- 102 Fernhead Ave