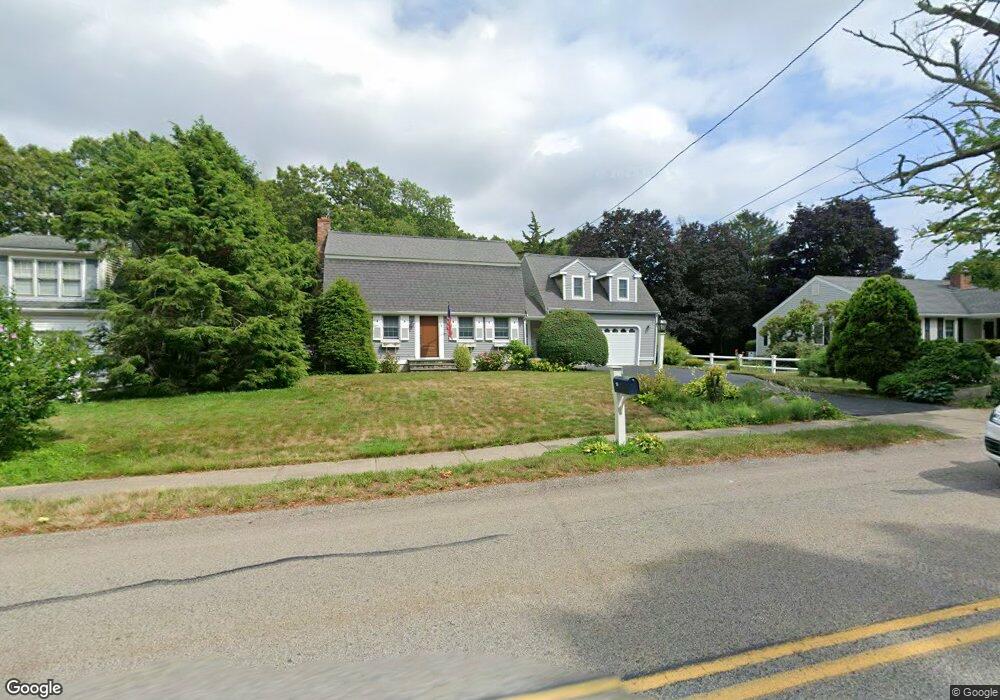
28 Obery St Plymouth, MA 02360
Estimated Value: $716,000 - $866,000
3
Beds
2
Baths
2,048
Sq Ft
$387/Sq Ft
Est. Value
About This Home
This home is located at 28 Obery St, Plymouth, MA 02360 and is currently estimated at $791,678, approximately $386 per square foot. 28 Obery St is a home located in Plymouth County with nearby schools including Nathaniel Morton Elementary School, Plymouth Community Intermediate, and Plymouth North High School.
Ownership History
Date
Name
Owned For
Owner Type
Purchase Details
Closed on
Feb 24, 2004
Sold by
Sullivan Richard P and Sullivan Anne J
Bought by
Sullivan Richard P and Sullivan Anne J
Current Estimated Value
Purchase Details
Closed on
Apr 14, 1993
Sold by
Caramello James C and Carmello Caroline J
Bought by
Sullivan Richard P and Cunneen Anne J
Create a Home Valuation Report for This Property
The Home Valuation Report is an in-depth analysis detailing your home's value as well as a comparison with similar homes in the area
Home Values in the Area
Average Home Value in this Area
Purchase History
| Date | Buyer | Sale Price | Title Company |
|---|---|---|---|
| Sullivan Richard P | -- | -- | |
| Sullivan Richard P | $121,000 | -- |
Source: Public Records
Mortgage History
| Date | Status | Borrower | Loan Amount |
|---|---|---|---|
| Open | Sullivan Richard P | $147,000 | |
| Closed | Sullivan Richard P | $182,000 | |
| Previous Owner | Sullivan Richard P | $160,000 |
Source: Public Records
Tax History Compared to Growth
Tax History
| Year | Tax Paid | Tax Assessment Tax Assessment Total Assessment is a certain percentage of the fair market value that is determined by local assessors to be the total taxable value of land and additions on the property. | Land | Improvement |
|---|---|---|---|---|
| 2025 | $7,816 | $615,900 | $278,400 | $337,500 |
| 2024 | $7,407 | $575,500 | $262,400 | $313,100 |
| 2023 | $7,159 | $522,200 | $227,400 | $294,800 |
| 2022 | $6,652 | $431,100 | $217,200 | $213,900 |
| 2021 | $6,543 | $404,900 | $217,200 | $187,700 |
| 2020 | $6,409 | $392,000 | $206,200 | $185,800 |
| 2019 | $6,363 | $384,700 | $197,200 | $187,500 |
| 2018 | $6,000 | $364,500 | $177,200 | $187,300 |
| 2017 | $5,783 | $348,800 | $177,200 | $171,600 |
| 2016 | $5,703 | $350,500 | $177,200 | $173,300 |
| 2015 | $5,470 | $352,000 | $177,200 | $174,800 |
| 2014 | $5,194 | $343,300 | $177,200 | $166,100 |
Source: Public Records
Map
Nearby Homes
- 15 Coles Ln
- 253 Sandwich St
- 9 Hill Dale Rd
- 4 Nook Rd
- 72 Warren Ave
- 45 Curtis Dr
- 57 A Stafford St Unit 57A
- 14-16 South St
- 27 1/2 Fremont St Unit 2
- 69 Cliff St
- 12 Old Barn Rd
- 60 Bramhall Ln
- 91 Newfield St Unit 34
- 91 Newfield St Unit 23
- 14 Meadowbrook Dr
- 18 River St
- 8 Carver St
- 49 Bumble Bee Dr
- 5 Bumble Bee Dr
- 126 Summer St