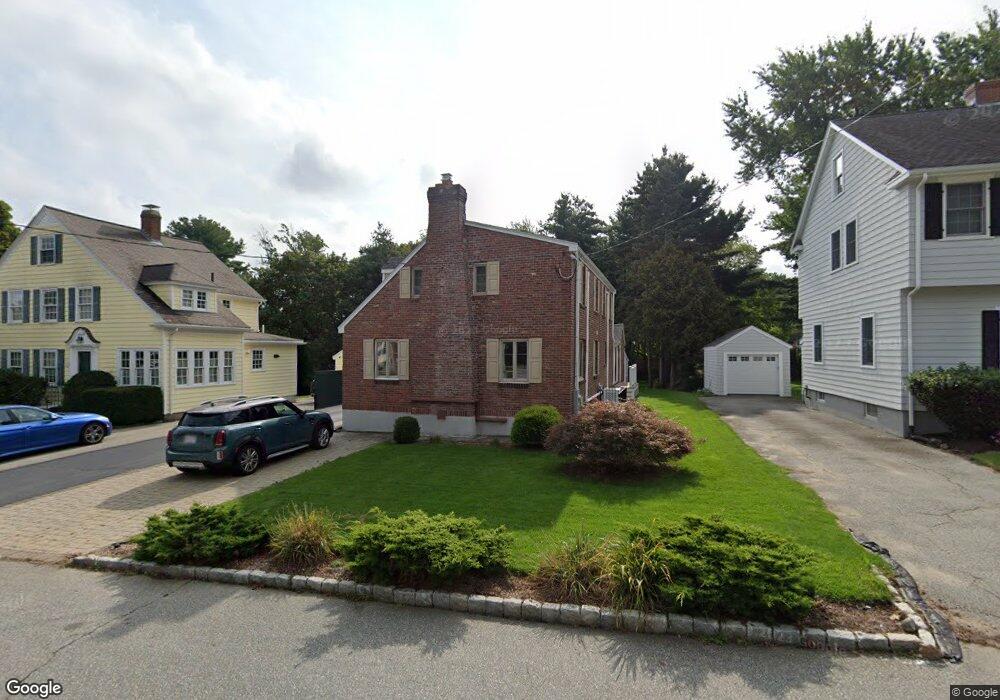
28 Oneida Rd Winchester, MA 01890
West Side NeighborhoodEstimated Value: $1,346,465 - $1,581,000
3
Beds
1
Bath
1,729
Sq Ft
$832/Sq Ft
Est. Value
About This Home
This home is located at 28 Oneida Rd, Winchester, MA 01890 and is currently estimated at $1,438,366, approximately $831 per square foot. 28 Oneida Rd is a home located in Middlesex County with nearby schools including Ambrose Elementary School, McCall Middle School, and Winchester High School.
Ownership History
Date
Name
Owned For
Owner Type
Purchase Details
Closed on
Jul 22, 2014
Sold by
Madenjian Gail B
Bought by
Gail B Madenjian Lt and Madenjian Gail B
Current Estimated Value
Purchase Details
Closed on
Mar 4, 2014
Sold by
Nishan Bichajian Ft and Madenjian Gail B
Bought by
Madenjian Gail B
Home Financials for this Owner
Home Financials are based on the most recent Mortgage that was taken out on this home.
Original Mortgage
$100,000
Interest Rate
4.39%
Mortgage Type
Credit Line Revolving
Purchase Details
Closed on
Nov 5, 2012
Sold by
Est Bichajian Louise and Bichajian Nishan
Bought by
Nishan Bichajian Lt and Bichajian Nishan
Purchase Details
Closed on
Mar 5, 2012
Sold by
Bichajian Nishan
Bought by
Nishan Bichajian Lt and Bichajian Nishan
Create a Home Valuation Report for This Property
The Home Valuation Report is an in-depth analysis detailing your home's value as well as a comparison with similar homes in the area
Home Values in the Area
Average Home Value in this Area
Purchase History
| Date | Buyer | Sale Price | Title Company |
|---|---|---|---|
| Gail B Madenjian Lt | -- | -- | |
| Madenjian Gail B | -- | -- | |
| Nishan Bichajian Lt | -- | -- | |
| Nishan Bichajian Lt | -- | -- |
Source: Public Records
Mortgage History
| Date | Status | Borrower | Loan Amount |
|---|---|---|---|
| Previous Owner | Madenjian Gail B | $100,000 |
Source: Public Records
Tax History
| Year | Tax Paid | Tax Assessment Tax Assessment Total Assessment is a certain percentage of the fair market value that is determined by local assessors to be the total taxable value of land and additions on the property. | Land | Improvement |
|---|---|---|---|---|
| 2025 | $134 | $1,211,900 | $914,100 | $297,800 |
| 2024 | $12,962 | $1,144,000 | $848,800 | $295,200 |
| 2023 | $11,804 | $1,000,300 | $718,200 | $282,100 |
| 2022 | $12,106 | $967,700 | $685,600 | $282,100 |
| 2021 | $10,740 | $837,100 | $555,000 | $282,100 |
| 2020 | $9,968 | $804,500 | $522,400 | $282,100 |
| 2019 | $9,346 | $771,800 | $489,700 | $282,100 |
| 2018 | $9,079 | $744,800 | $471,800 | $273,000 |
| 2017 | $8,289 | $675,000 | $420,300 | $254,700 |
| 2016 | $7,778 | $665,900 | $420,300 | $245,600 |
| 2015 | $7,110 | $585,700 | $351,000 | $234,700 |
| 2014 | $7,216 | $570,000 | $351,000 | $219,000 |
Source: Public Records
Map
Nearby Homes
Your Personal Tour Guide
Ask me questions while you tour the home.