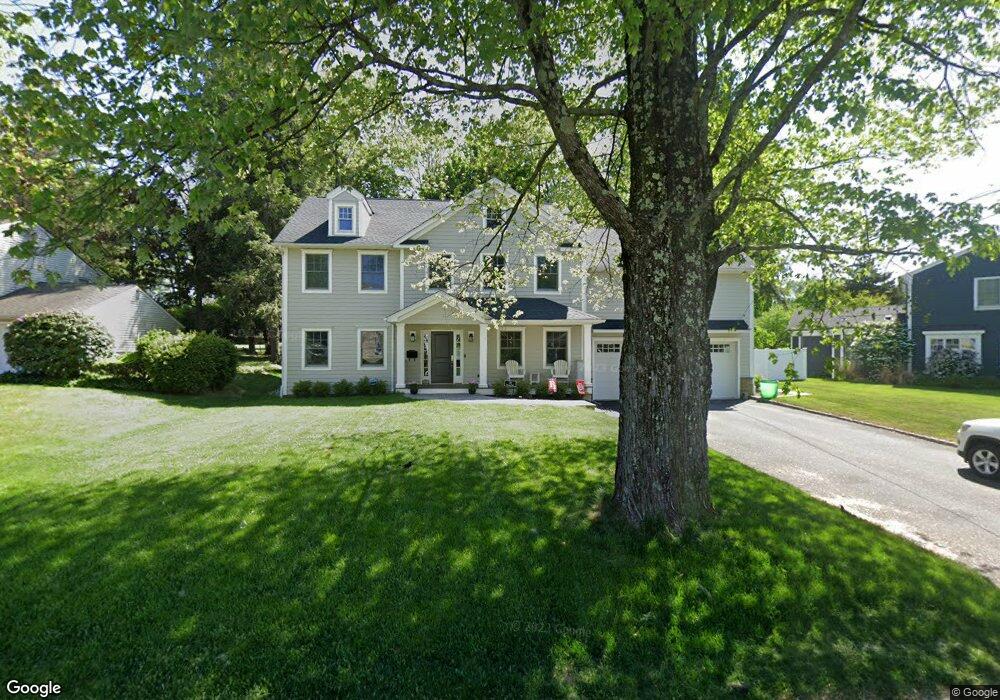
28 Orchard Rd Florham Park, NJ 07932
Estimated Value: $1,785,000
--
Bed
--
Bath
3,593
Sq Ft
$497/Sq Ft
Est. Value
About This Home
This home is located at 28 Orchard Rd, Florham Park, NJ 07932 and is currently estimated at $1,785,000, approximately $496 per square foot. 28 Orchard Rd is a home located in Morris County with nearby schools including Briarwood Elementary School, Brooklake Elementary School, and Ridgedale Middle School.
Ownership History
Date
Name
Owned For
Owner Type
Purchase Details
Closed on
Apr 6, 2005
Sold by
Kinney John
Bought by
Ciprich James and Ciprich Christine
Current Estimated Value
Home Financials for this Owner
Home Financials are based on the most recent Mortgage that was taken out on this home.
Original Mortgage
$452,000
Outstanding Balance
$326,203
Interest Rate
5%
Mortgage Type
Adjustable Rate Mortgage/ARM
Estimated Equity
$1,458,797
Purchase Details
Closed on
Jun 21, 2000
Sold by
Wyatt John T and Wyatt Christine S
Bought by
Kinney John P and Kinney Ella
Home Financials for this Owner
Home Financials are based on the most recent Mortgage that was taken out on this home.
Original Mortgage
$274,000
Interest Rate
7.25%
Create a Home Valuation Report for This Property
The Home Valuation Report is an in-depth analysis detailing your home's value as well as a comparison with similar homes in the area
Home Values in the Area
Average Home Value in this Area
Purchase History
| Date | Buyer | Sale Price | Title Company |
|---|---|---|---|
| Ciprich James | $565,000 | -- | |
| Kinney John P | $342,500 | -- |
Source: Public Records
Mortgage History
| Date | Status | Borrower | Loan Amount |
|---|---|---|---|
| Open | Ciprich James | $452,000 | |
| Previous Owner | Kinney John P | $274,000 |
Source: Public Records
Tax History Compared to Growth
Tax History
| Year | Tax Paid | Tax Assessment Tax Assessment Total Assessment is a certain percentage of the fair market value that is determined by local assessors to be the total taxable value of land and additions on the property. | Land | Improvement |
|---|---|---|---|---|
| 2025 | $13,523 | $832,700 | $417,200 | $415,500 |
| 2024 | $13,307 | $832,700 | $417,200 | $415,500 |
| 2023 | $13,307 | $832,700 | $417,200 | $415,500 |
| 2022 | $13,323 | $832,700 | $417,200 | $415,500 |
| 2021 | $13,323 | $832,700 | $417,200 | $415,500 |
| 2020 | $13,048 | $832,700 | $417,200 | $415,500 |
| 2019 | $12,824 | $832,700 | $417,200 | $415,500 |
| 2018 | $8,545 | $565,500 | $417,200 | $148,300 |
| 2017 | $8,330 | $565,500 | $417,200 | $148,300 |
| 2016 | $8,104 | $565,500 | $417,200 | $148,300 |
| 2015 | $7,962 | $565,500 | $417,200 | $148,300 |
| 2014 | $7,793 | $565,500 | $417,200 | $148,300 |
Source: Public Records
Map
Nearby Homes