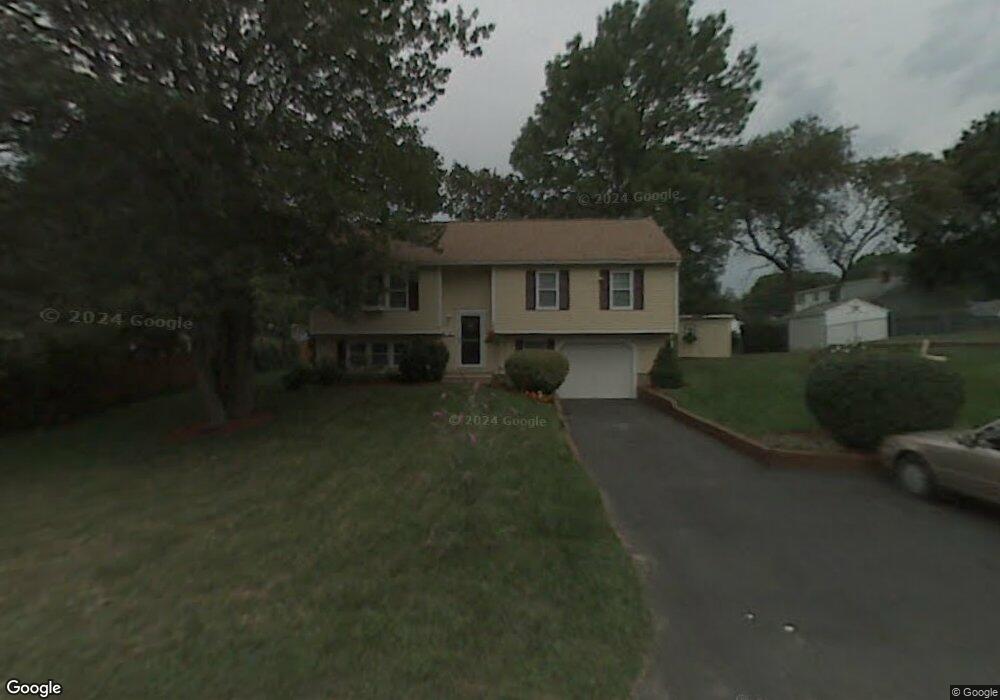
28 Overlook Ave Webster, MA 01570
Estimated Value: $397,000 - $427,000
3
Beds
2
Baths
1,396
Sq Ft
$297/Sq Ft
Est. Value
About This Home
This home is located at 28 Overlook Ave, Webster, MA 01570 and is currently estimated at $415,175, approximately $297 per square foot. 28 Overlook Ave is a home located in Worcester County with nearby schools including Park Avenue Elementary School, Webster Middle School, and Bartlett High School.
Ownership History
Date
Name
Owned For
Owner Type
Purchase Details
Closed on
Sep 20, 2016
Sold by
Robert J & A Mulrain Irt
Bought by
Diluzio Derrick W
Current Estimated Value
Home Financials for this Owner
Home Financials are based on the most recent Mortgage that was taken out on this home.
Original Mortgage
$189,150
Outstanding Balance
$151,086
Interest Rate
3.43%
Mortgage Type
New Conventional
Estimated Equity
$264,089
Purchase Details
Closed on
Mar 25, 2011
Sold by
Mulrain Robert J and Mulrain Arlene M
Bought by
Mulrain Robert and Mulrain Arlene
Create a Home Valuation Report for This Property
The Home Valuation Report is an in-depth analysis detailing your home's value as well as a comparison with similar homes in the area
Home Values in the Area
Average Home Value in this Area
Purchase History
| Date | Buyer | Sale Price | Title Company |
|---|---|---|---|
| Diluzio Derrick W | $195,000 | -- | |
| Mulrain Robert | -- | -- |
Source: Public Records
Mortgage History
| Date | Status | Borrower | Loan Amount |
|---|---|---|---|
| Open | Diluzio Derrick W | $189,150 |
Source: Public Records
Tax History Compared to Growth
Tax History
| Year | Tax Paid | Tax Assessment Tax Assessment Total Assessment is a certain percentage of the fair market value that is determined by local assessors to be the total taxable value of land and additions on the property. | Land | Improvement |
|---|---|---|---|---|
| 2025 | $4,182 | $352,000 | $60,400 | $291,600 |
| 2024 | $4,124 | $338,600 | $58,100 | $280,500 |
| 2023 | $3,706 | $296,500 | $55,300 | $241,200 |
| 2022 | $3,554 | $254,600 | $53,700 | $200,900 |
| 2021 | $3,561 | $235,800 | $51,400 | $184,400 |
| 2020 | $3,420 | $227,100 | $51,400 | $175,700 |
| 2019 | $3,074 | $200,500 | $51,400 | $149,100 |
| 2018 | $2,909 | $189,000 | $49,000 | $140,000 |
| 2017 | $2,773 | $183,300 | $48,000 | $135,300 |
| 2016 | $2,534 | $167,400 | $45,700 | $121,700 |
| 2015 | $2,327 | $158,500 | $44,800 | $113,700 |
Source: Public Records
Map
Nearby Homes
- 730 School St
- 46 Crosby St
- 19 Highcrest Park
- 17 Crosby St Unit B
- 8 Ridge Dr
- 418 High Street Extension
- 14 Hill St
- 28 Carpenter Rd
- 19 1st St
- 30 Valley St
- 17 Mount Pleasant St
- 18 Fairview Ave
- 51 &52 lot Oscar Rd
- 15 Brook St
- 8 Warsaw Ave Unit 1
- 48 Myrtle Ave
- 40 High St
- 11 Williams St
- 21 Prospect Ave
- 14 Central Ave