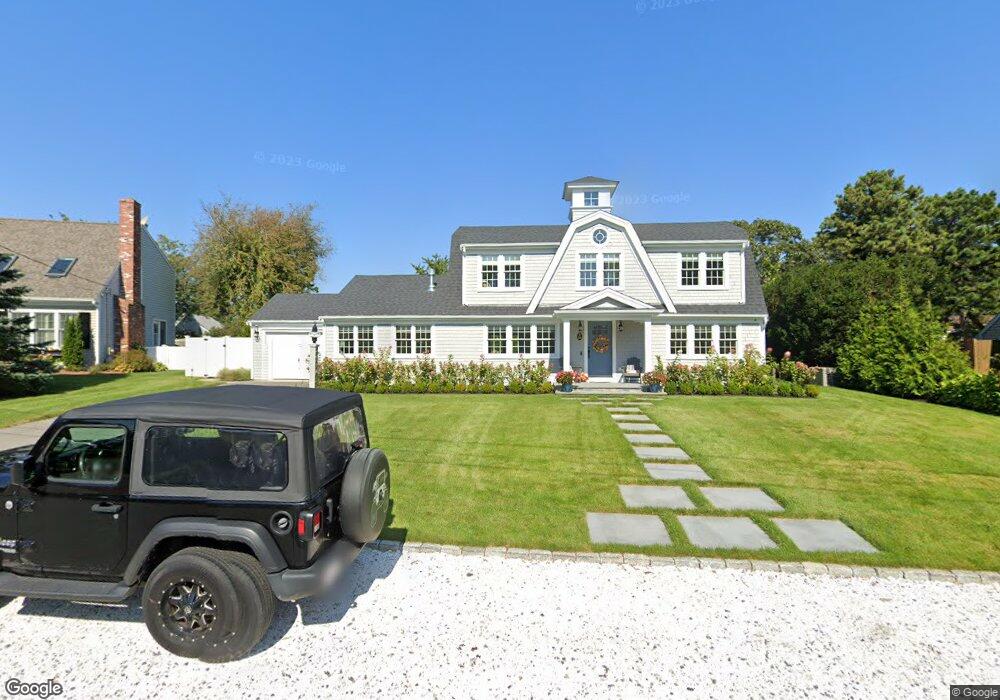
28 Porter Ln West Dennis, MA 02670
West Dennis NeighborhoodEstimated Value: $1,160,000 - $1,875,937
3
Beds
2
Baths
1,289
Sq Ft
$1,097/Sq Ft
Est. Value
About This Home
This home is located at 28 Porter Ln, West Dennis, MA 02670 and is currently estimated at $1,413,484, approximately $1,096 per square foot. 28 Porter Ln is a home located in Barnstable County with nearby schools including Dennis-Yarmouth Regional High School.
Ownership History
Date
Name
Owned For
Owner Type
Purchase Details
Closed on
Oct 22, 2009
Sold by
Caruso Salvatore and Caruso Virginia M
Bought by
Caruso Kimberley A
Current Estimated Value
Home Financials for this Owner
Home Financials are based on the most recent Mortgage that was taken out on this home.
Original Mortgage
$275,000
Outstanding Balance
$179,662
Interest Rate
5.09%
Mortgage Type
Purchase Money Mortgage
Estimated Equity
$1,233,822
Purchase Details
Closed on
Sep 30, 1994
Sold by
Gallagher Eleanor C and Tougas Paul J
Bought by
Caruso Salvatore and Caruso Virginia M
Home Financials for this Owner
Home Financials are based on the most recent Mortgage that was taken out on this home.
Original Mortgage
$124,400
Interest Rate
8.5%
Mortgage Type
Purchase Money Mortgage
Create a Home Valuation Report for This Property
The Home Valuation Report is an in-depth analysis detailing your home's value as well as a comparison with similar homes in the area
Home Values in the Area
Average Home Value in this Area
Purchase History
| Date | Buyer | Sale Price | Title Company |
|---|---|---|---|
| Caruso Kimberley A | $500,000 | -- | |
| Caruso Salvatore | $155,500 | -- |
Source: Public Records
Mortgage History
| Date | Status | Borrower | Loan Amount |
|---|---|---|---|
| Open | Caruso Kimberley A | $275,000 | |
| Previous Owner | Caruso Salvatore | $146,000 | |
| Previous Owner | Caruso Salvatore | $146,000 | |
| Previous Owner | Caruso Salvatore | $124,400 |
Source: Public Records
Tax History Compared to Growth
Tax History
| Year | Tax Paid | Tax Assessment Tax Assessment Total Assessment is a certain percentage of the fair market value that is determined by local assessors to be the total taxable value of land and additions on the property. | Land | Improvement |
|---|---|---|---|---|
| 2025 | $5,778 | $1,334,500 | $544,600 | $789,900 |
| 2024 | $4,387 | $999,300 | $523,700 | $475,600 |
| 2023 | $4,243 | $908,600 | $476,100 | $432,500 |
| 2022 | $3,948 | $705,000 | $386,000 | $319,000 |
| 2021 | $4,033 | $668,800 | $378,400 | $290,400 |
| 2020 | $3,808 | $624,300 | $360,400 | $263,900 |
| 2019 | $3,558 | $576,700 | $353,400 | $223,300 |
| 2018 | $6,433 | $572,100 | $336,400 | $235,700 |
| 2017 | $3,474 | $564,800 | $336,400 | $228,400 |
| 2016 | $3,575 | $547,400 | $353,200 | $194,200 |
| 2015 | $3,503 | $547,400 | $353,200 | $194,200 |
| 2014 | $3,298 | $519,400 | $325,200 | $194,200 |
Source: Public Records
Map
Nearby Homes
- 2 Rita Mary Way
- 181 Pleasant St
- 14 Schoolhouse Ln
- 308 Old Main St
- 209 Main St Unit 3
- 209 Main St Unit 6
- 209 Main St Unit 1
- 209 Main St Unit 2
- 209 Main St Unit 4
- 209 Main St Unit 5
- 745 Willow St
- 178 School St
- 45 Seth Ln
- 40 Kelley Rd
- 23 Doric Ave
- 22 Powhatan Rd
- 17 South St
- 29 Bass River Rd
- 15 Sharon Rd
- 401 Main St Unit 201