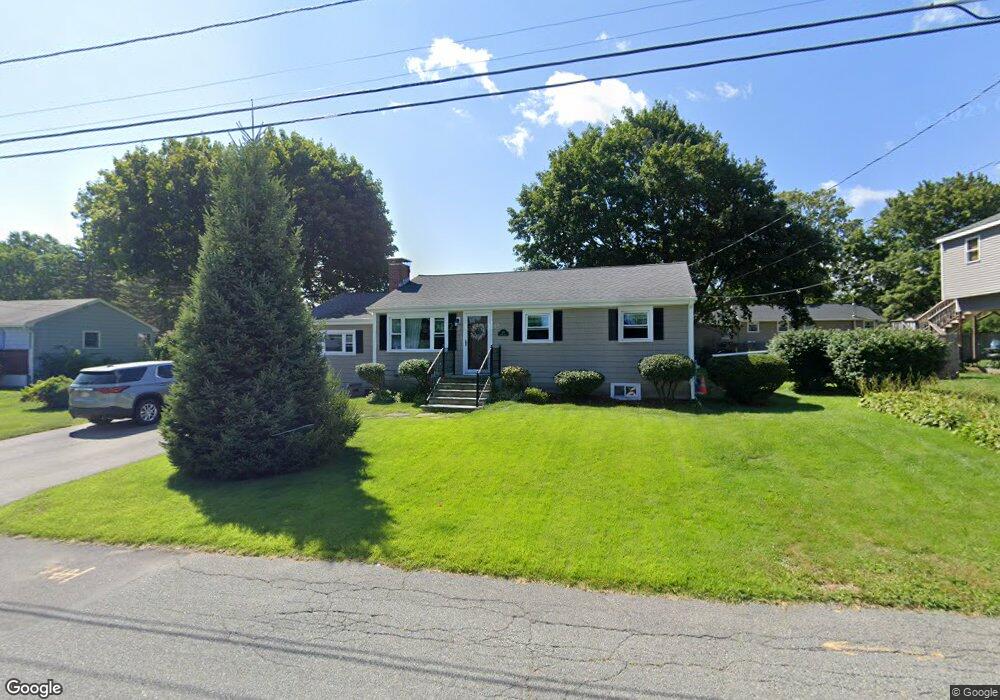
28 Porter Rd Marlborough, MA 01752
Estimated Value: $601,000 - $641,000
3
Beds
3
Baths
1,738
Sq Ft
$355/Sq Ft
Est. Value
About This Home
This home is located at 28 Porter Rd, Marlborough, MA 01752 and is currently estimated at $617,519, approximately $355 per square foot. 28 Porter Rd is a home located in Middlesex County with nearby schools including Marlborough High School, New Covenant Christian School, and Glenhaven Academy - JRI School.
Ownership History
Date
Name
Owned For
Owner Type
Purchase Details
Closed on
Jan 5, 2009
Sold by
Kotsopoulos Joanne and Kotsopoulos Steven K
Bought by
S&J Kotsopoulos Lt and Kotsopoulos Joanne C
Current Estimated Value
Purchase Details
Closed on
Jan 25, 1994
Sold by
Butler Doris J
Bought by
Kotsopoulos Steven K and Kotsopoulos Joanne
Home Financials for this Owner
Home Financials are based on the most recent Mortgage that was taken out on this home.
Original Mortgage
$102,400
Interest Rate
7.08%
Mortgage Type
Purchase Money Mortgage
Create a Home Valuation Report for This Property
The Home Valuation Report is an in-depth analysis detailing your home's value as well as a comparison with similar homes in the area
Home Values in the Area
Average Home Value in this Area
Purchase History
| Date | Buyer | Sale Price | Title Company |
|---|---|---|---|
| S&J Kotsopoulos Lt | -- | -- | |
| Kotsopoulos Steven K | $128,000 | -- |
Source: Public Records
Mortgage History
| Date | Status | Borrower | Loan Amount |
|---|---|---|---|
| Previous Owner | Kotsopoulos Steven K | $94,550 | |
| Previous Owner | Kotsopoulos Steven K | $10,000 | |
| Previous Owner | Kotsopoulos Steven K | $102,400 | |
| Previous Owner | Kotsopoulos Steven K | $46,000 |
Source: Public Records
Tax History Compared to Growth
Tax History
| Year | Tax Paid | Tax Assessment Tax Assessment Total Assessment is a certain percentage of the fair market value that is determined by local assessors to be the total taxable value of land and additions on the property. | Land | Improvement |
|---|---|---|---|---|
| 2025 | $5,036 | $510,800 | $220,000 | $290,800 |
| 2024 | $5,088 | $496,900 | $200,000 | $296,900 |
| 2023 | $5,266 | $456,300 | $168,700 | $287,600 |
| 2022 | $5,113 | $389,700 | $160,700 | $229,000 |
| 2021 | $0 | $373,000 | $133,900 | $239,100 |
| 2020 | $6,554 | $359,900 | $127,500 | $232,400 |
| 2019 | $5,006 | $355,800 | $125,000 | $230,800 |
| 2018 | $4,569 | $312,300 | $99,300 | $213,000 |
| 2017 | $4,438 | $289,700 | $98,500 | $191,200 |
| 2016 | $4,357 | $284,000 | $98,500 | $185,500 |
| 2015 | $4,129 | $262,000 | $100,700 | $161,300 |
Source: Public Records
Map
Nearby Homes