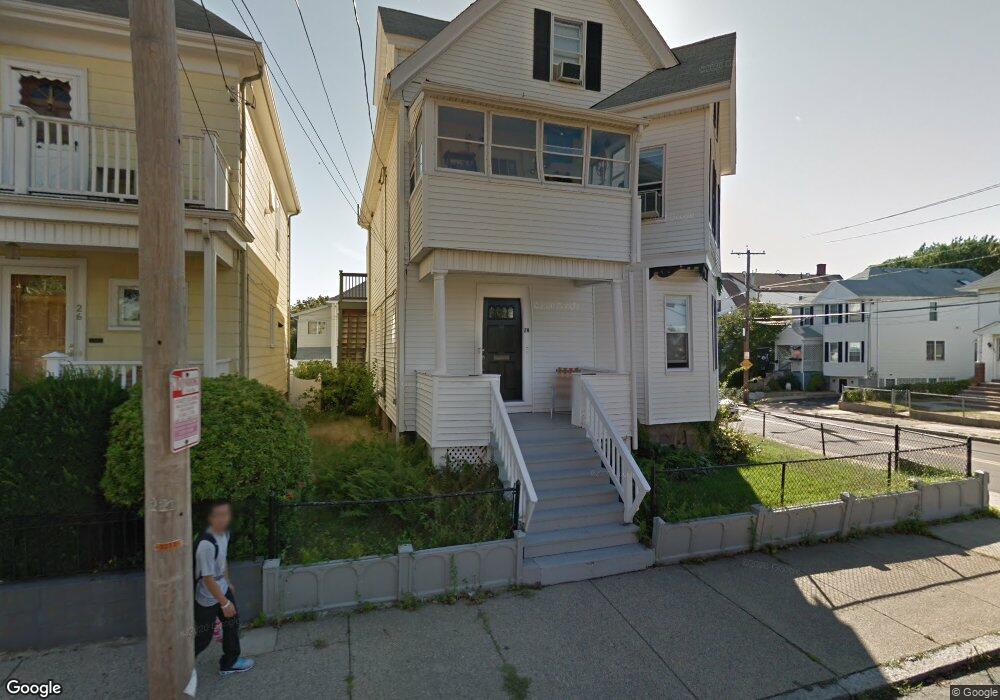
28 Porter St Everett, MA 02149
Glendale NeighborhoodEstimated Value: $694,661 - $843,000
4
Beds
2
Baths
1,904
Sq Ft
$404/Sq Ft
Est. Value
About This Home
This home is located at 28 Porter St, Everett, MA 02149 and is currently estimated at $768,915, approximately $403 per square foot. 28 Porter St is a home located in Middlesex County with nearby schools including Malden High School.
Ownership History
Date
Name
Owned For
Owner Type
Purchase Details
Closed on
Mar 22, 2022
Sold by
Miller Lance C
Bought by
Miller Lance C and Moscato Jason A
Current Estimated Value
Home Financials for this Owner
Home Financials are based on the most recent Mortgage that was taken out on this home.
Original Mortgage
$484,000
Outstanding Balance
$453,417
Interest Rate
4.16%
Mortgage Type
Stand Alone Refi Refinance Of Original Loan
Estimated Equity
$315,498
Purchase Details
Closed on
Sep 10, 2015
Sold by
Calvey Thomas F and Calvey Mary E
Bought by
Miller Lance C
Home Financials for this Owner
Home Financials are based on the most recent Mortgage that was taken out on this home.
Original Mortgage
$402,475
Interest Rate
4.4%
Mortgage Type
FHA
Create a Home Valuation Report for This Property
The Home Valuation Report is an in-depth analysis detailing your home's value as well as a comparison with similar homes in the area
Home Values in the Area
Average Home Value in this Area
Purchase History
| Date | Buyer | Sale Price | Title Company |
|---|---|---|---|
| Miller Lance C | -- | None Available | |
| Miller Lance C | -- | None Available | |
| Miller Lance C | $409,900 | -- |
Source: Public Records
Mortgage History
| Date | Status | Borrower | Loan Amount |
|---|---|---|---|
| Open | Miller Lance C | $484,000 | |
| Closed | Miller Lance C | $484,000 | |
| Previous Owner | Miller Lance C | $402,475 |
Source: Public Records
Tax History
| Year | Tax Paid | Tax Assessment Tax Assessment Total Assessment is a certain percentage of the fair market value that is determined by local assessors to be the total taxable value of land and additions on the property. | Land | Improvement |
|---|---|---|---|---|
| 2025 | $8,290 | $727,800 | $246,600 | $481,200 |
| 2024 | $7,587 | $662,000 | $216,000 | $446,000 |
| 2023 | $7,423 | $630,100 | $206,600 | $423,500 |
| 2022 | $6,127 | $591,400 | $197,300 | $394,100 |
| 2021 | $5,525 | $559,800 | $176,600 | $383,200 |
| 2020 | $5,826 | $547,600 | $176,600 | $371,000 |
| 2019 | $6,118 | $494,200 | $168,100 | $326,100 |
| 2018 | $6,030 | $437,600 | $146,500 | $291,100 |
| 2017 | $5,733 | $397,000 | $131,500 | $265,500 |
| 2016 | $4,478 | $309,900 | $117,400 | $192,500 |
| 2015 | $4,184 | $286,400 | $105,900 | $180,500 |
Source: Public Records
Map
Nearby Homes
- 5 Mason St
- 881 Broadway Unit 44
- 859 Broadway Unit 15
- 51 Thurman St
- 112 Hadley St
- 13 Coolidge St
- 378 Ferry St
- 132 Vernal St
- 19 Mills St
- 51 Adams Ave
- 21 Hillside Ave Unit 21
- 272-274 Cross St Unit 4
- 272-274 Cross St Unit 3
- 211 Elm St
- 40-42 Upham St Unit 1
- 21 Central Ave Unit 10
- 20 Fairmount St
- 21 Staples Ave Unit 26
- 15 Staples Ave Unit 45
- 15 Staples Ave Unit 31
Your Personal Tour Guide
Ask me questions while you tour the home.