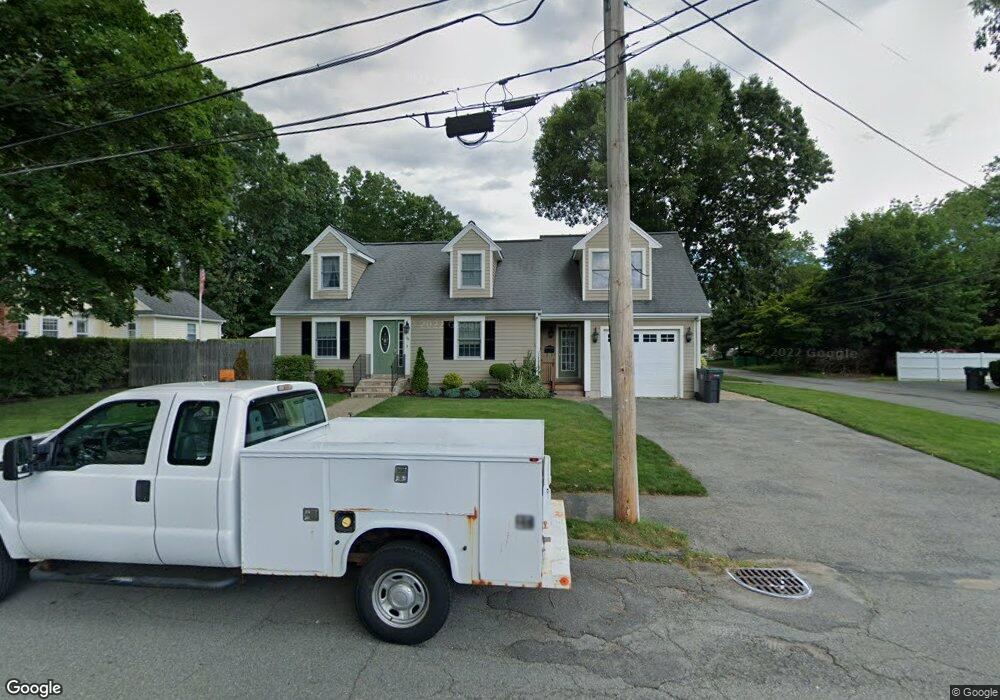
28 Proctor St Natick, MA 01760
Estimated Value: $971,494 - $1,177,000
3
Beds
2
Baths
2,355
Sq Ft
$458/Sq Ft
Est. Value
About This Home
This home is located at 28 Proctor St, Natick, MA 01760 and is currently estimated at $1,078,874, approximately $458 per square foot. 28 Proctor St is a home located in Middlesex County with nearby schools including Natick High School, Johnson Elementary School, and J F Kennedy Middle School.
Ownership History
Date
Name
Owned For
Owner Type
Purchase Details
Closed on
Mar 24, 1999
Sold by
Black Joan M
Bought by
Hartwell Gerald P and Hartwell Laurie A
Current Estimated Value
Home Financials for this Owner
Home Financials are based on the most recent Mortgage that was taken out on this home.
Original Mortgage
$174,000
Outstanding Balance
$42,220
Interest Rate
6.78%
Mortgage Type
Purchase Money Mortgage
Estimated Equity
$1,036,655
Create a Home Valuation Report for This Property
The Home Valuation Report is an in-depth analysis detailing your home's value as well as a comparison with similar homes in the area
Home Values in the Area
Average Home Value in this Area
Purchase History
| Date | Buyer | Sale Price | Title Company |
|---|---|---|---|
| Hartwell Gerald P | $226,800 | -- |
Source: Public Records
Mortgage History
| Date | Status | Borrower | Loan Amount |
|---|---|---|---|
| Open | Hartwell Gerald P | $174,000 | |
| Previous Owner | Hartwell Gerald P | $60,000 |
Source: Public Records
Tax History Compared to Growth
Tax History
| Year | Tax Paid | Tax Assessment Tax Assessment Total Assessment is a certain percentage of the fair market value that is determined by local assessors to be the total taxable value of land and additions on the property. | Land | Improvement |
|---|---|---|---|---|
| 2025 | $9,103 | $761,100 | $406,100 | $355,000 |
| 2024 | $8,732 | $712,200 | $382,200 | $330,000 |
| 2023 | $8,610 | $681,200 | $367,900 | $313,300 |
| 2022 | $8,012 | $600,600 | $334,400 | $266,200 |
| 2021 | $7,690 | $565,000 | $315,300 | $249,700 |
| 2020 | $7,495 | $550,700 | $301,000 | $249,700 |
| 2019 | $5,067 | $550,700 | $301,000 | $249,700 |
| 2018 | $6,764 | $518,300 | $286,700 | $231,600 |
| 2017 | $6,355 | $471,100 | $243,600 | $227,500 |
| 2016 | $6,036 | $444,800 | $219,400 | $225,400 |
| 2015 | $5,889 | $426,100 | $219,400 | $206,700 |
Source: Public Records
Map
Nearby Homes
- 1 Fern St
- 91 Speen St
- 4 Sylvia Ave
- 16 West St
- 46 Silver Hill Ln Unit 1
- 40 Silver Hill Ln Unit 4
- 26 Walden Dr Unit 4
- 9 Silver Hill Ln Unit 19
- 32 Silver Hill Ln Unit 1
- 25 Forest Ave
- 12 Walden Dr Unit 19
- 216-218 S Main St
- 47 High St
- 2 Lodge Rd
- 6 Ambler Ct
- 105 N Main St
- 58 W Central St
- 10 Kelsey Rd
- 8 Floral Avenue Extension
- 57 Village Brook Ln Unit 5