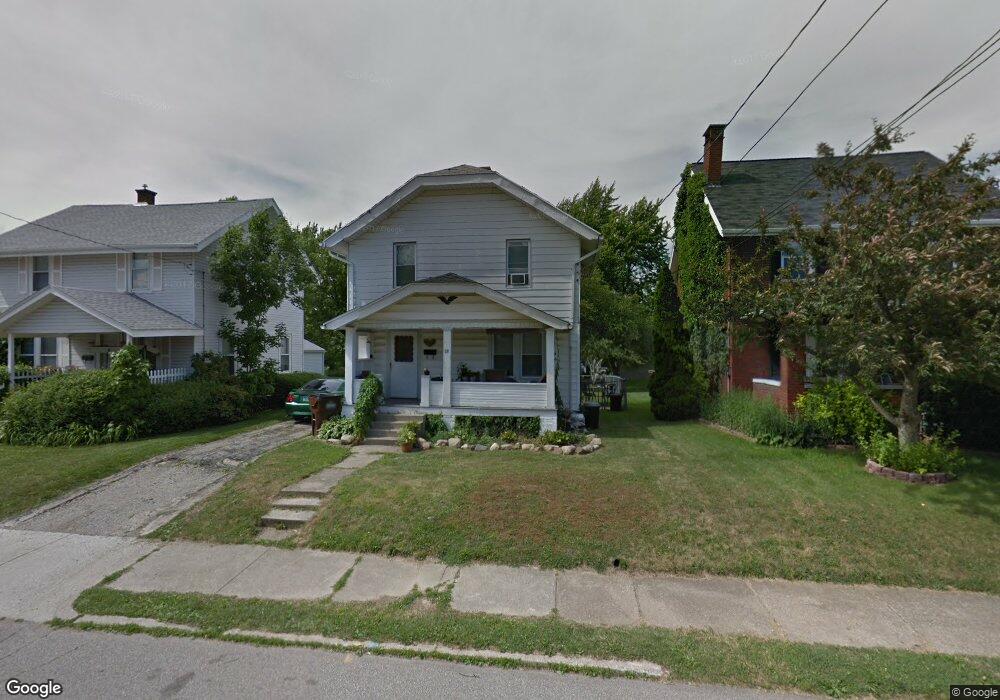
28 Reba Ave Mansfield, OH 44907
Estimated Value: $100,000 - $111,000
2
Beds
2
Baths
960
Sq Ft
$112/Sq Ft
Est. Value
About This Home
This home is located at 28 Reba Ave, Mansfield, OH 44907 and is currently estimated at $107,267, approximately $111 per square foot. 28 Reba Ave is a home located in Richland County with nearby schools including St. Peter's Elementary/Montessori School, Discovery School, and St. Peter's Junior High / High School.
Ownership History
Date
Name
Owned For
Owner Type
Purchase Details
Closed on
Sep 29, 2020
Sold by
Guinn Wayne and Nottingham Louise R
Bought by
Akers John H and Akers Anne E
Current Estimated Value
Home Financials for this Owner
Home Financials are based on the most recent Mortgage that was taken out on this home.
Original Mortgage
$42,000
Outstanding Balance
$37,357
Interest Rate
2.9%
Mortgage Type
Credit Line Revolving
Estimated Equity
$69,910
Purchase Details
Closed on
Feb 27, 2020
Sold by
Estate Of Robert S Nottingham
Bought by
Nottingham Louise R
Purchase Details
Closed on
Mar 4, 2016
Sold by
Nottingham Robert S and Nottingham Louise R
Bought by
Nottingham Robert S and Guinn Wayne
Purchase Details
Closed on
Feb 24, 2004
Sold by
Craig Barbara L
Bought by
Nottingham Robert S
Purchase Details
Closed on
Apr 24, 1991
Sold by
Matthes Jeanette A
Bought by
Craig Barbara Louise
Create a Home Valuation Report for This Property
The Home Valuation Report is an in-depth analysis detailing your home's value as well as a comparison with similar homes in the area
Home Values in the Area
Average Home Value in this Area
Purchase History
| Date | Buyer | Sale Price | Title Company |
|---|---|---|---|
| Akers John H | $60,000 | Barristers Title Group | |
| Nottingham Louise R | -- | None Available | |
| Nottingham Robert S | -- | Attorney | |
| Nottingham Robert S | $24,000 | -- | |
| Craig Barbara Louise | -- | -- |
Source: Public Records
Mortgage History
| Date | Status | Borrower | Loan Amount |
|---|---|---|---|
| Open | Akers John H | $42,000 |
Source: Public Records
Tax History
| Year | Tax Paid | Tax Assessment Tax Assessment Total Assessment is a certain percentage of the fair market value that is determined by local assessors to be the total taxable value of land and additions on the property. | Land | Improvement |
|---|---|---|---|---|
| 2024 | $1,310 | $27,360 | $5,300 | $22,060 |
| 2023 | $1,310 | $27,360 | $5,300 | $22,060 |
| 2022 | $1,014 | $17,750 | $5,220 | $12,530 |
| 2021 | $1,021 | $17,750 | $5,220 | $12,530 |
| 2020 | $1,044 | $17,750 | $5,220 | $12,530 |
| 2019 | $987 | $15,130 | $4,420 | $10,710 |
| 2018 | $974 | $15,130 | $4,420 | $10,710 |
| 2017 | $948 | $15,130 | $4,420 | $10,710 |
| 2016 | $681 | $10,550 | $4,420 | $6,130 |
| 2015 | $651 | $10,550 | $4,420 | $6,130 |
| 2014 | $642 | $10,550 | $4,420 | $6,130 |
| 2012 | $246 | $10,550 | $4,420 | $6,130 |
Source: Public Records
Map
Nearby Homes
- 394 S Main St
- 27 Dunbilt Ct
- 377 S Main St
- 219 Lexington Ave
- 101 Chilton Ave
- 0 Cline Ave Hedeen Abbeyfeale Unit 9066362
- 133 Winwood Dr
- 151 Grover St
- 286 S Main St
- 273 Hammond Ave
- 530 Wood St
- 507 Townview Cir E
- 466 Lexington Ave
- 470 Lexington Ave
- 22 Small Ave
- 310 Townview Cir N
- 571 Luther St
- 212 S Main St
- 29 Ford Ave
- 519 S Diamond St
Your Personal Tour Guide
Ask me questions while you tour the home.