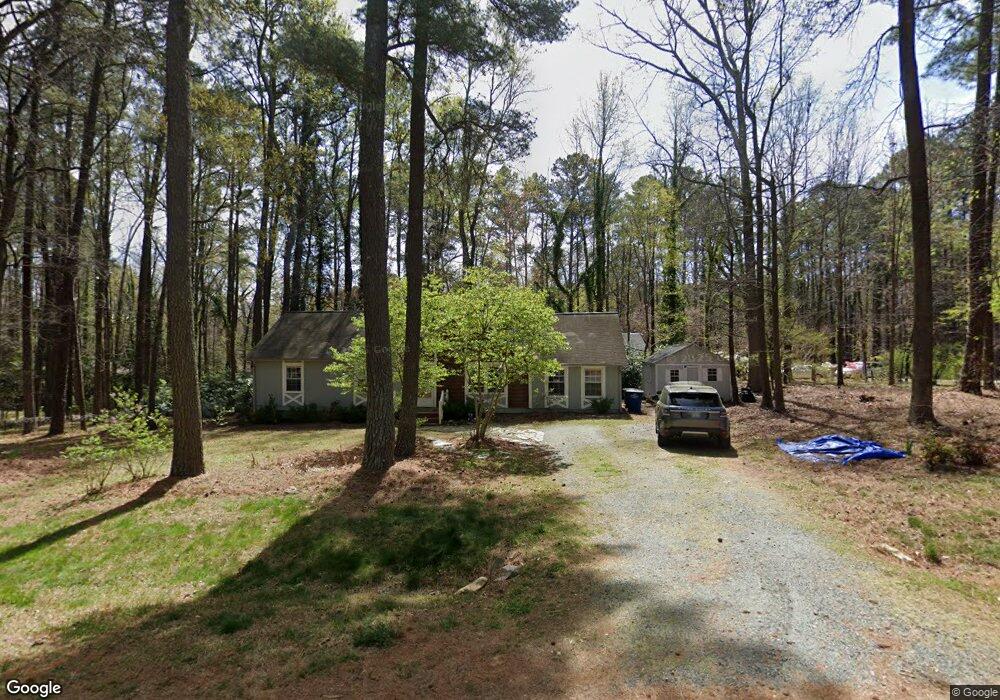
28 Red Pine Rd Chapel Hill, NC 27516
Estimated Value: $324,000 - $408,000
3
Beds
2
Baths
1,440
Sq Ft
$261/Sq Ft
Est. Value
About This Home
This home is located at 28 Red Pine Rd, Chapel Hill, NC 27516 and is currently estimated at $375,386, approximately $260 per square foot. 28 Red Pine Rd is a home located in Chatham County with nearby schools including Margaret B. Pollard Middle School, Northwood High, and Woods Charter.
Ownership History
Date
Name
Owned For
Owner Type
Purchase Details
Closed on
Jun 30, 2020
Sold by
Johnson Arvilla
Bought by
Baker Adrienne
Current Estimated Value
Home Financials for this Owner
Home Financials are based on the most recent Mortgage that was taken out on this home.
Original Mortgage
$194,400
Outstanding Balance
$172,321
Interest Rate
3.2%
Mortgage Type
New Conventional
Estimated Equity
$203,065
Purchase Details
Closed on
Sep 23, 2019
Sold by
Stiffler Jason R
Bought by
Johnson Arvilla
Home Financials for this Owner
Home Financials are based on the most recent Mortgage that was taken out on this home.
Original Mortgage
$160,200
Interest Rate
3.87%
Mortgage Type
Adjustable Rate Mortgage/ARM
Purchase Details
Closed on
Jan 29, 2016
Sold by
Bell Oscar Larkin and Bell Karen M
Bought by
Stiffler Jason R
Home Financials for this Owner
Home Financials are based on the most recent Mortgage that was taken out on this home.
Original Mortgage
$182,500
Interest Rate
4.25%
Mortgage Type
Adjustable Rate Mortgage/ARM
Purchase Details
Closed on
Dec 31, 1996
Bought by
Bell Oscar Larkin
Create a Home Valuation Report for This Property
The Home Valuation Report is an in-depth analysis detailing your home's value as well as a comparison with similar homes in the area
Home Values in the Area
Average Home Value in this Area
Purchase History
| Date | Buyer | Sale Price | Title Company |
|---|---|---|---|
| Baker Adrienne | $243,000 | None Available | |
| Johnson Arvilla | $178,000 | None Available | |
| Stiffler Jason R | $185,500 | Attorney | |
| Bell Oscar Larkin | -- | -- |
Source: Public Records
Mortgage History
| Date | Status | Borrower | Loan Amount |
|---|---|---|---|
| Open | Baker Adrienne | $194,400 | |
| Previous Owner | Johnson Arvilla | $160,200 | |
| Previous Owner | Stiffler Jason R | $182,500 |
Source: Public Records
Tax History
| Year | Tax Paid | Tax Assessment Tax Assessment Total Assessment is a certain percentage of the fair market value that is determined by local assessors to be the total taxable value of land and additions on the property. | Land | Improvement |
|---|---|---|---|---|
| 2025 | $2,144 | $283,008 | $57,600 | $225,408 |
| 2024 | $2,144 | $210,033 | $39,600 | $170,433 |
| 2023 | $1,929 | $210,033 | $39,600 | $170,433 |
| 2022 | $1,770 | $210,033 | $39,600 | $170,433 |
| 2021 | $1,749 | $210,033 | $39,600 | $170,433 |
| 2020 | $1,531 | $180,686 | $34,020 | $146,666 |
| 2019 | $1,531 | $180,686 | $34,020 | $146,666 |
| 2018 | $1,446 | $180,686 | $34,020 | $146,666 |
| 2017 | $1,446 | $180,686 | $34,020 | $146,666 |
| 2016 | $1,407 | $174,008 | $32,400 | $141,608 |
| 2015 | -- | $174,008 | $32,400 | $141,608 |
| 2014 | $1,360 | $174,008 | $32,400 | $141,608 |
| 2013 | -- | $174,008 | $32,400 | $141,608 |
Source: Public Records
Map
Nearby Homes
- 68 Willow Way
- 67 Willow Way
- 136 Loblolly Ln
- 67 Gracehope Ln
- 23 Bonterra Way
- 221 Gracehope Ln
- 614 Great Ridge Pkwy
- 560 Great Ridge Pkwy
- 646 Great Ridge Pkwy
- 109 Persimmon Hill Rd
- 17 Monteith Dr
- 39 Monteith Dr
- 203 Post Oak Rd
- 183 Post Oak Rd
- 676 Tobacco Farm Way
- 540 Patterson Dr
- 700 Tobacco Farm Way
- 0 Manns Chapel Rd Unit 10144728
- 93 Kenwood Ln
- 153 Abercorn Cir
- 38 Mulberry Ln
- 29 Red Pine Rd
- 23 Red Pine Rd
- 22 Red Pine Rd
- 37 White Oak Trail
- 36 White Oak Trail
- 25 Mulberry Ln
- 26 Mulberry Ln
- 35 White Oak Trail
- 24 Red Pine Rd
- 21 Red Pine Rd
- 30 Red Pine Rd
- 27 Mulberry Ln
- 34 White Oak Trail
- 20 Red Pine Rd
- 41 White Oak Trail
- 40 White Oak Trail
- 31 White Oak Trail
- 42 White Oak Trail
- 43 White Oak Trail
Your Personal Tour Guide
Ask me questions while you tour the home.