Estimated Value: $416,696 - $489,000
3
Beds
3
Baths
2,418
Sq Ft
$193/Sq Ft
Est. Value
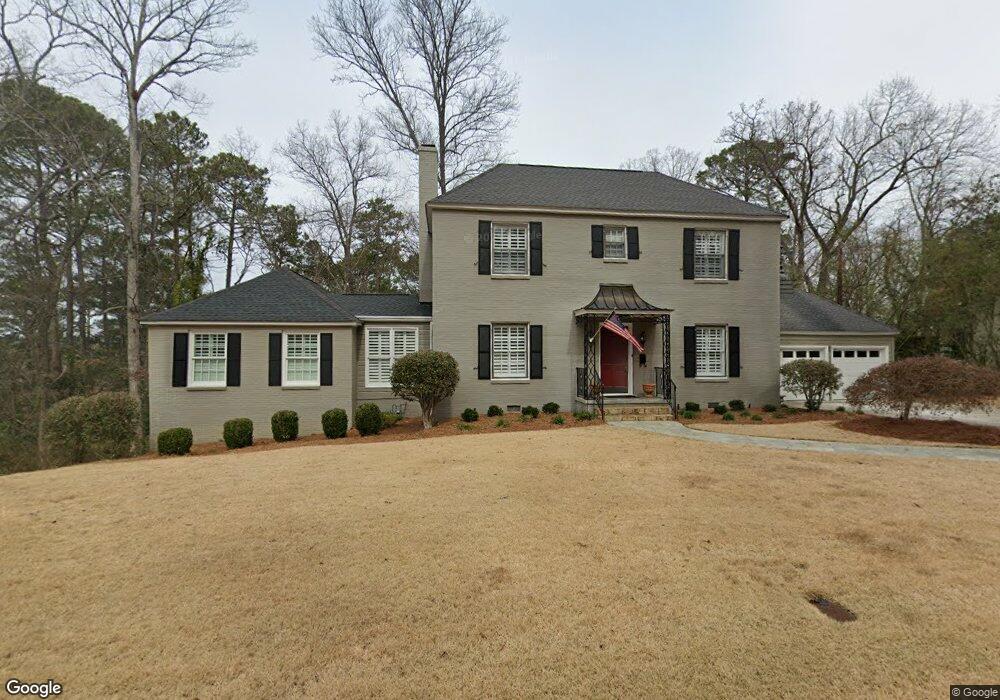
About This Home
This home is located at 28 Rockridge Rd SW, Rome, GA 30165 and is currently estimated at $466,424, approximately $192 per square foot. 28 Rockridge Rd SW is a home located in Floyd County with nearby schools including Rome High School, St. Mary School, and Darlington School.
Ownership History
Date
Name
Owned For
Owner Type
Purchase Details
Closed on
Nov 18, 2013
Sold by
Abney James King
Bought by
Abney James King and Abney Charlene Faye
Current Estimated Value
Purchase Details
Closed on
Oct 13, 1992
Bought by
P and R
Purchase Details
Closed on
Jun 4, 1987
Sold by
Kerr Anne Rooney
Bought by
Abney James K and Abney Elizabeth K
Purchase Details
Closed on
Jul 1, 1982
Sold by
Kerr Frederick B
Bought by
Kerr Anne Rooney
Purchase Details
Closed on
Sep 30, 1977
Sold by
Markel Howard B
Bought by
Kerr Frederick B
Purchase Details
Closed on
Oct 30, 1975
Sold by
Markel Howard B and Markel Luanne M
Bought by
Markel Howard B
Purchase Details
Closed on
Nov 10, 1971
Sold by
Howell Adrian and Covington Jas R
Bought by
Markel Howard B and Markel Luanne M
Purchase Details
Closed on
Mar 27, 1968
Sold by
Shropshire Forrest H
Bought by
Howell Adrian and Covington Jas R
Purchase Details
Closed on
Jan 1, 1901
Bought by
Shropshire Forrest H
Create a Home Valuation Report for This Property
The Home Valuation Report is an in-depth analysis detailing your home's value as well as a comparison with similar homes in the area
Home Values in the Area
Average Home Value in this Area
Purchase History
| Date | Buyer | Sale Price | Title Company |
|---|---|---|---|
| Abney James King | $199,084 | -- | |
| Abney James King | $199,084 | -- | |
| P | -- | -- | |
| Abney James K | $110,000 | -- | |
| Kerr Anne Rooney | -- | -- | |
| Kerr Frederick B | $68,000 | -- | |
| Markel Howard B | -- | -- | |
| Markel Howard B | $41,000 | -- | |
| Howell Adrian | $13,000 | -- | |
| Shropshire Forrest H | -- | -- |
Source: Public Records
Tax History Compared to Growth
Tax History
| Year | Tax Paid | Tax Assessment Tax Assessment Total Assessment is a certain percentage of the fair market value that is determined by local assessors to be the total taxable value of land and additions on the property. | Land | Improvement |
|---|---|---|---|---|
| 2024 | $4,100 | $163,416 | $28,588 | $134,828 |
| 2023 | $4,167 | $169,212 | $25,671 | $143,541 |
| 2022 | $3,836 | $140,929 | $21,004 | $119,925 |
| 2021 | $3,687 | $128,675 | $21,004 | $107,671 |
| 2020 | $2,763 | $119,795 | $16,045 | $103,750 |
| 2019 | $2,665 | $115,685 | $16,045 | $99,640 |
| 2018 | $2,589 | $111,344 | $16,045 | $95,299 |
| 2017 | $3,193 | $105,893 | $16,045 | $89,848 |
| 2016 | $2,791 | $82,480 | $16,040 | $66,440 |
| 2015 | $2,600 | $82,480 | $16,040 | $66,440 |
| 2014 | $2,600 | $79,634 | $16,040 | $63,594 |
Source: Public Records
Map
Nearby Homes
- 19 Berckman Ln SW
- 17 Rosewood Rd SW
- 3 Berckman Ln SW
- 14 Berckman Ln SW
- 209 Sherwood Rd SW
- 9 Shorter Cir SW
- 13 Ridgewood Rd SW
- 0 Mount Alto Rd SW Unit 10523740
- 8 S Hughes St SW
- 16 Wilkerson Rd SW
- 6 Horseleg Creek Rd SW
- 2 Wayne St SW
- 17 Wilkerson Rd SW
- 4 Wayne St SW
- 50 Melton Ave SW
- 27 Bluff Mountain Dr SW
- 0 Unbridled Rd Unit 22 23074684
- 124 Sheridan Dr NW
- 23 Sweetspire Dr NW
- 21 Sweetspire Dr NW
- 26 Rockridge Rd SW
- 30 Rockridge Rd SW
- 105 Bass Ave SW
- 107 Bass Ave SW
- 103 Bass Ave SW
- 111 Bass Ave SW
- 343 Rockridge Dr
- 0 Rockridge Dr Unit 7535341
- 0 Rockridge Dr Unit 8451292
- 0 Rockridge Dr Unit 8290511
- 0 Rockridge Dr Unit 8272094
- 0 Rockridge Dr Unit 8181027
- 0 Rockridge Dr Unit 7381812
- 0 Rockridge Dr Unit 8994662
- 0 Rockridge Dr Unit 9007360
- 0 Rockridge Dr Unit 8724470
- 0 Rockridge Dr Unit 7116643
- 0 Rockridge Dr
- 32 Rockridge Rd SW
- 32 Rockridge Dr